View methods side by side.
Choose up to four methods. Add them using the search and share the comparison by copying its link.
| Criterion | 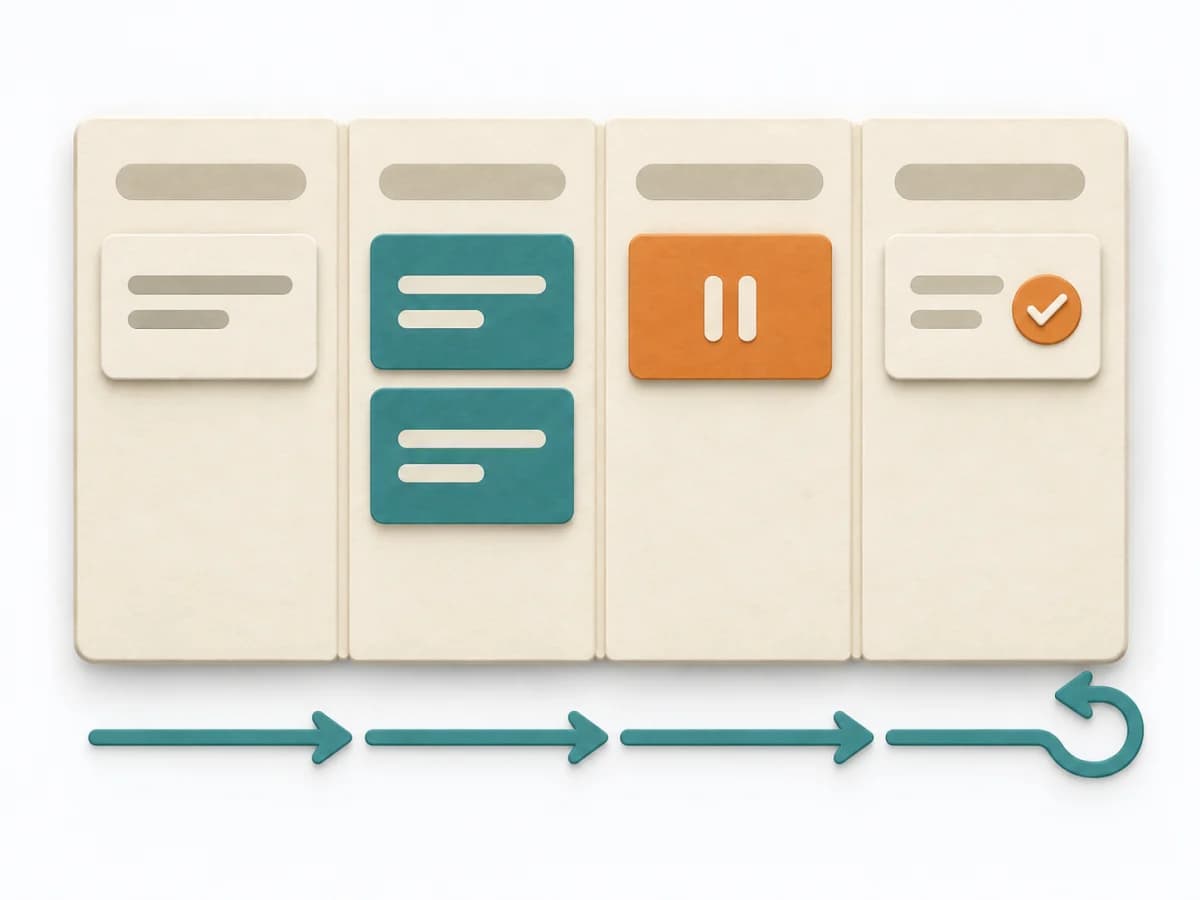 Engineering Kanban |  Agile NoEstimates | 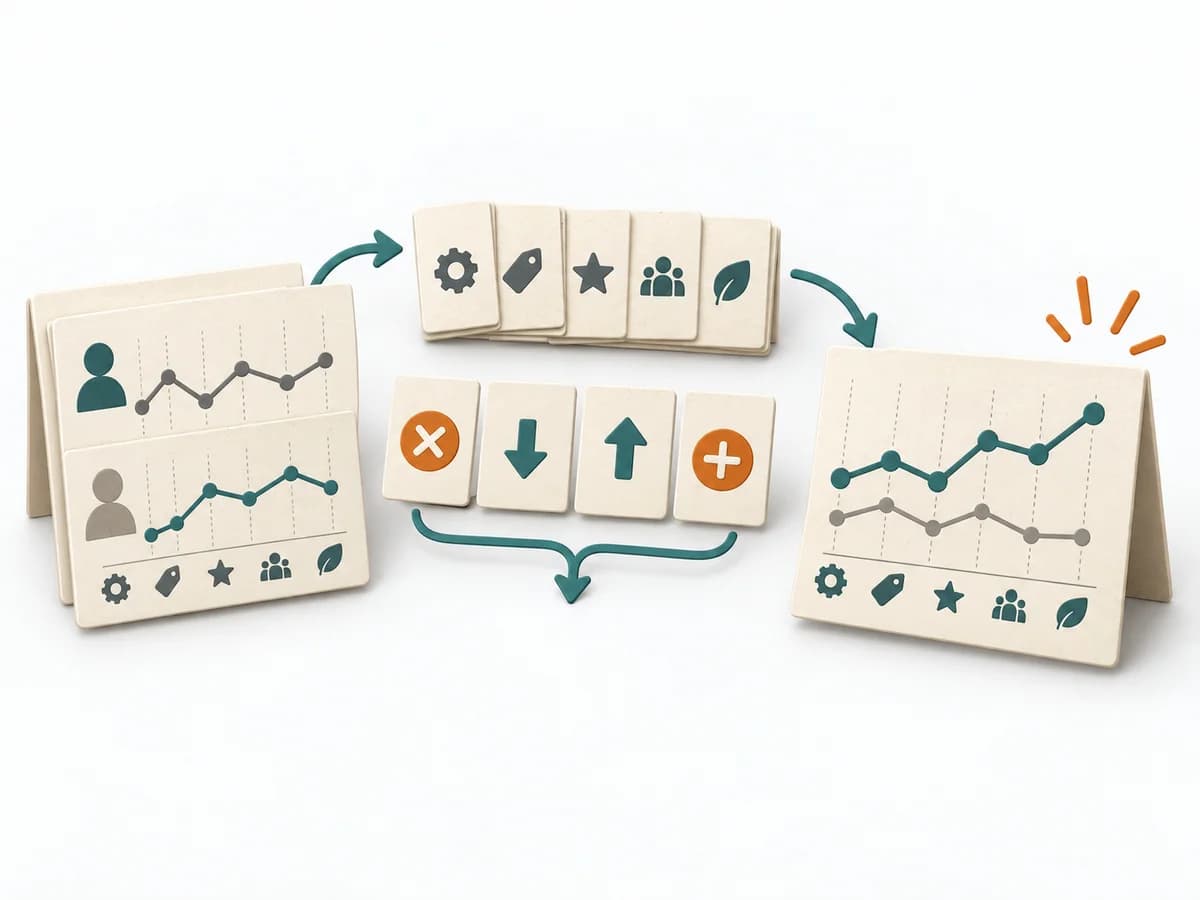 Business Strategy Blue Ocean Strategy Canvas | 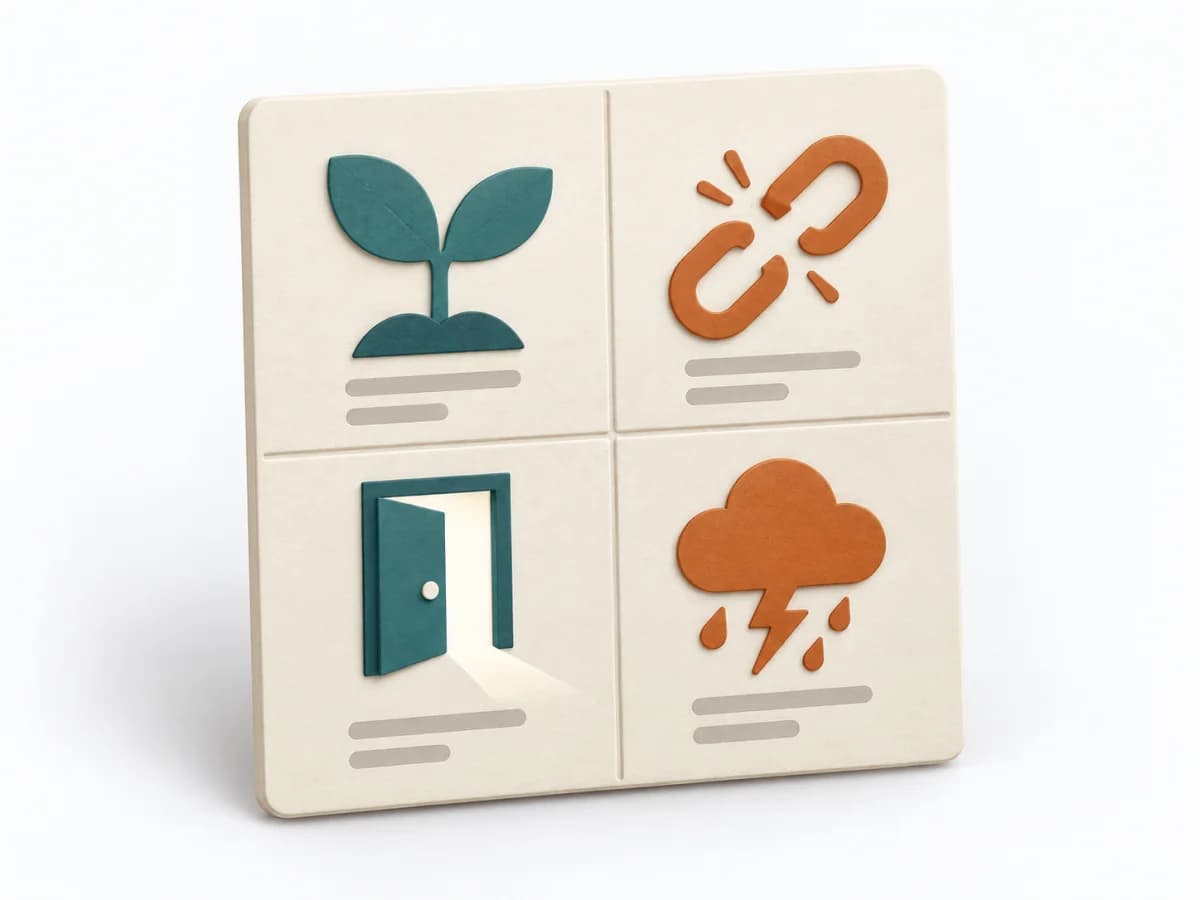 Business Strategy SWOT Analysis |
|---|---|---|---|---|
Purposedifferent | When work sits in too many parallel streams, throughput suffers and no one sees the bottlenecks. Kanban makes the flow of work visible and limits overload so a system becomes calmer and more predictable. | When estimating slows a team down more than it helps, it shifts the focus to flow, small slices, and real lead time. It sorts work by value, risk, and delivery ability. The result is captured as Throughput Data, Flow Forecast, and Slicing Rules. | The Blue Ocean Strategy Canvas shows how an offering is positioned relative to the market. Differentiation thereby becomes tangible in value factors instead of merely being claimed. | SWOT Analysis arranges strengths, weaknesses, opportunities, and threats into a compact picture of the situation. It keeps internal capabilities and external influences separate before strategic options emerge from them. |
Complexitydifferent | Medium | Medium | Medium | Low |
Timedifferent | Ongoing | laufend | 2-4 h | 30-60 min |
Participantsdifferent | 2-12 | 2-12 | 3-10 | 3-12 |
Formatdifferent | Workshop + async | Workshop + async | Workshop | Workshop |
Outputdifferent | Kanban board, WIP policies, Flow metrics | Throughput Data, Flow Forecast, Slicing Rules | Strategy Canvas, Value Curve, ERRC Actions | SWOT matrix, Strategic options, Action list |
Tagsno overlap | FlowVisual managementDelivery | EstimationForecastingFlow | StrategyPositioningInnovationValue | StrategyAnalysisMarketPositioning |