View methods side by side.
Choose up to four methods. Add them using the search and share the comparison by copying its link.
| Criterion |  UX Research Customer Journey Mapping | 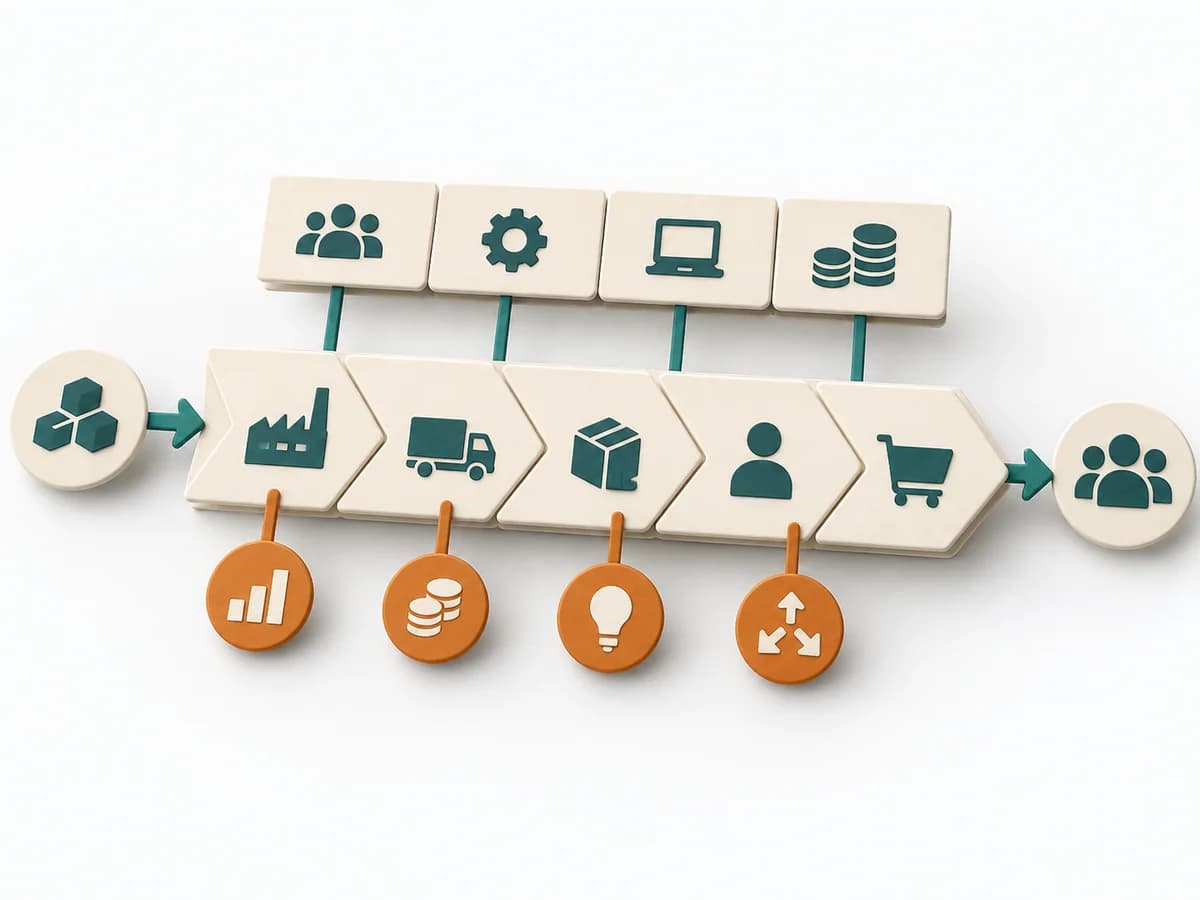 Business Strategy Value Chain Analysis | 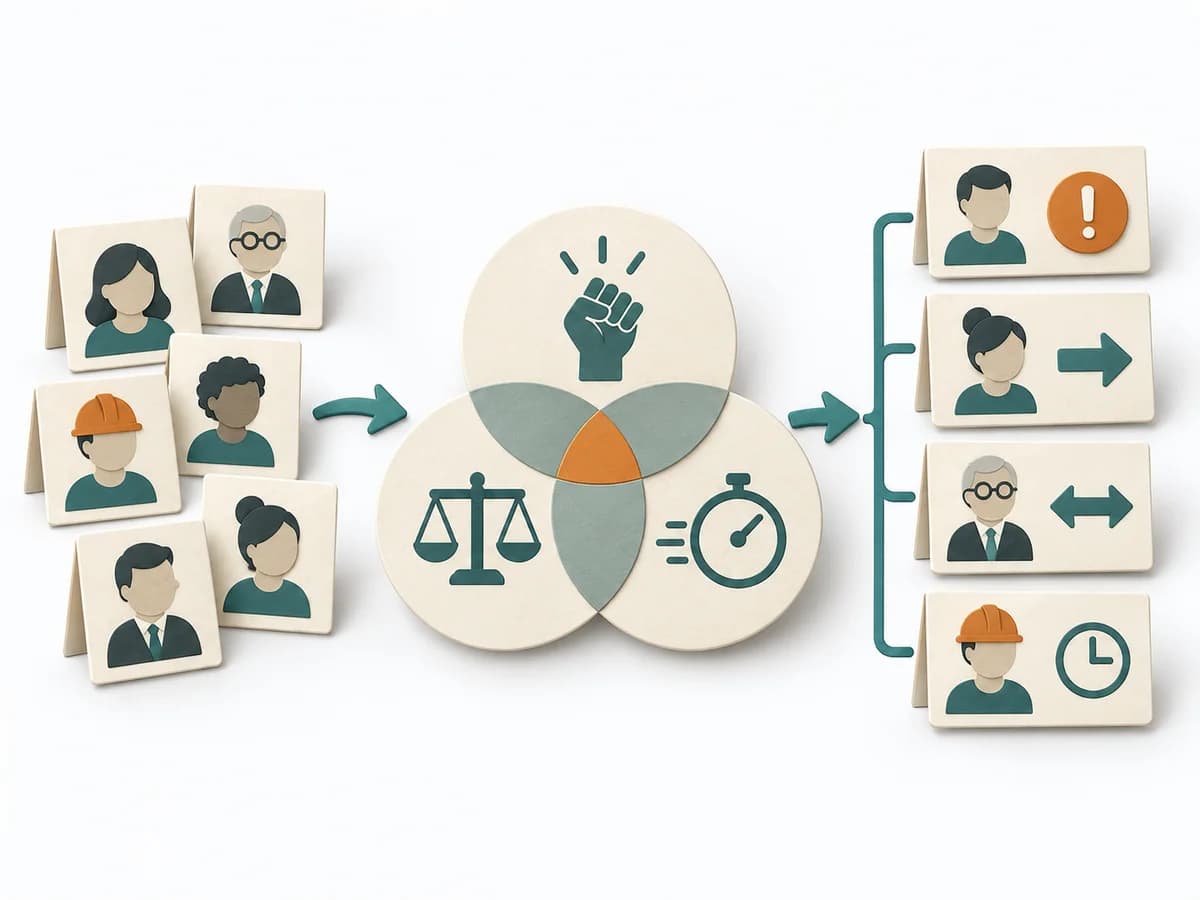 Facilitation Stakeholder Salience Model |  Facilitation Stakeholder Mapping |
|---|---|---|---|---|
Purposedifferent | When a user journey falls apart across many touchpoints, customer journey mapping makes the experience visible as a coherent arc. Phases, emotions, and breaks become legible enough to prioritize critical moments deliberately. | Value Chain Analysis shows where value is created, costs accrue, and differentiation becomes possible along the process. It compares strengths, risks, market logic, and courses of action. The result is captured as a value-chain map and lever list. | When stakeholders appear to matter very differently, the Stakeholder Salience Model rates their actual priority through power, legitimacy, and urgency. It turns individual contributions into a visible selection. The result is captured as a Salience diagram and a class-based strategy. | When an initiative depends on many people, interests, and power dynamics, Stakeholder Mapping systematically orders the environment. It shows who influences, who is affected, and where relationship management or safeguarding matters first. |
Complexitydifferent | Medium | High | Medium | Low |
Timedifferent | 2-4 h | Half day | 60-90 min | 60–90 min |
Participantsdifferent | 4-10 | 3-8 | 3-6 | 2-8 |
Formatdifferent | Workshop | Workshop | Workshop | Workshop + async |
Outputdifferent | Journey Map, Pain-point List, Opportunity Backlog | Value Chain Map, Lever List | Salience Diagram, Strategy per Class | Stakeholder Map, Engagement Plan, Risk Notes |
Tagsno overlap | JourneyServiceService design | StrategyBusiness modelDiagnosisAnalysis | StakeholdersFacilitationAlignmentGovernance | StakeholdersAlignmentFacilitationChange |