View methods side by side.
Choose up to four methods. Add them using the search and share the comparison by copying its link.
| Criterion |  UX Research Customer Journey Mapping | 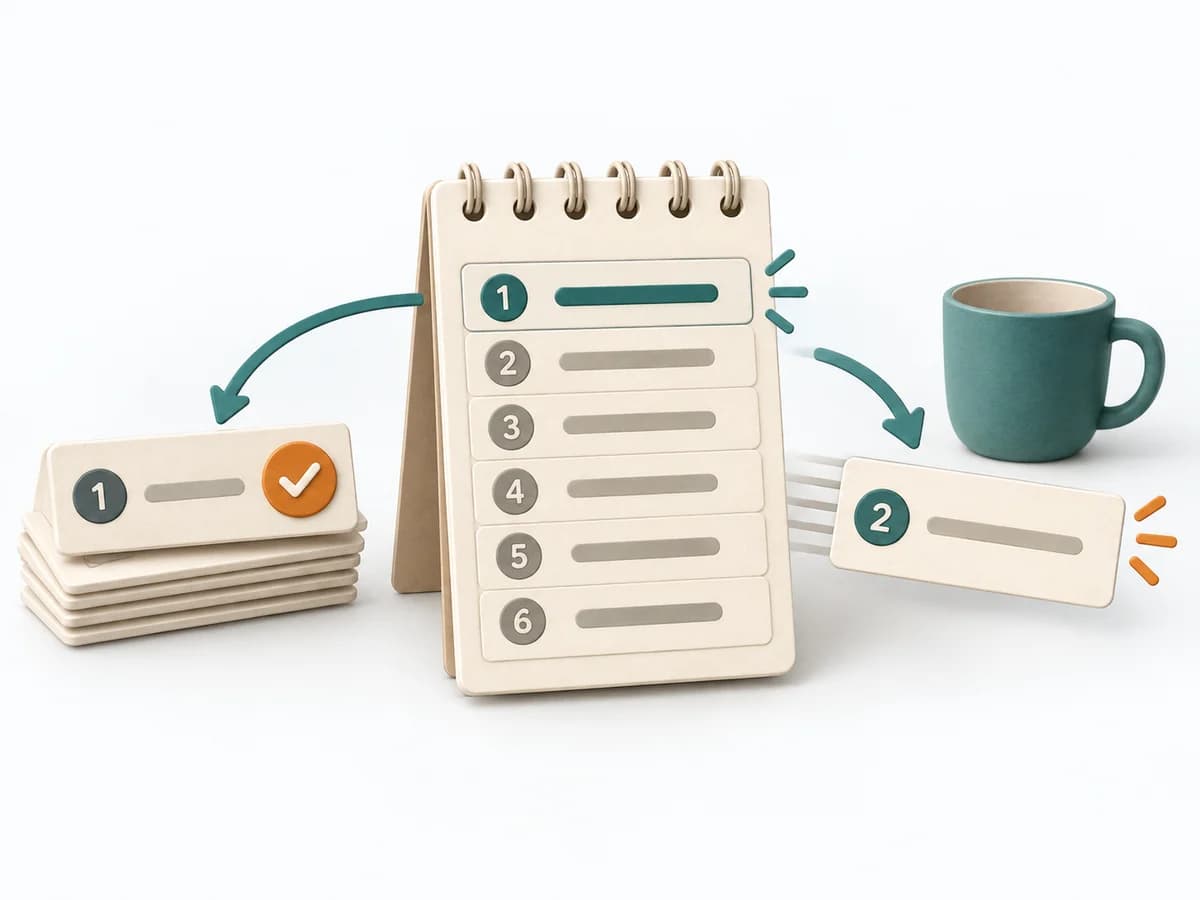 Operations Ivy Lee Method | 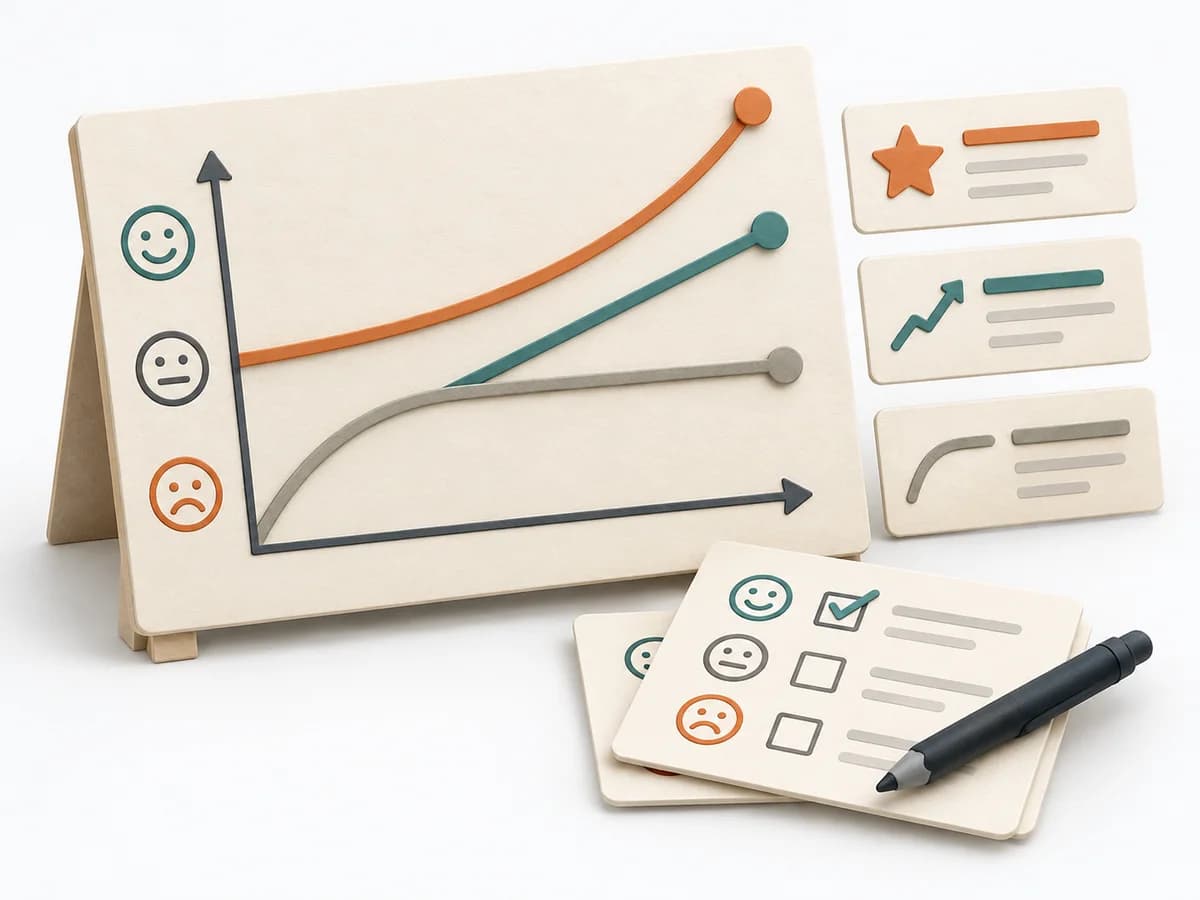 Product Discovery Kano Model | 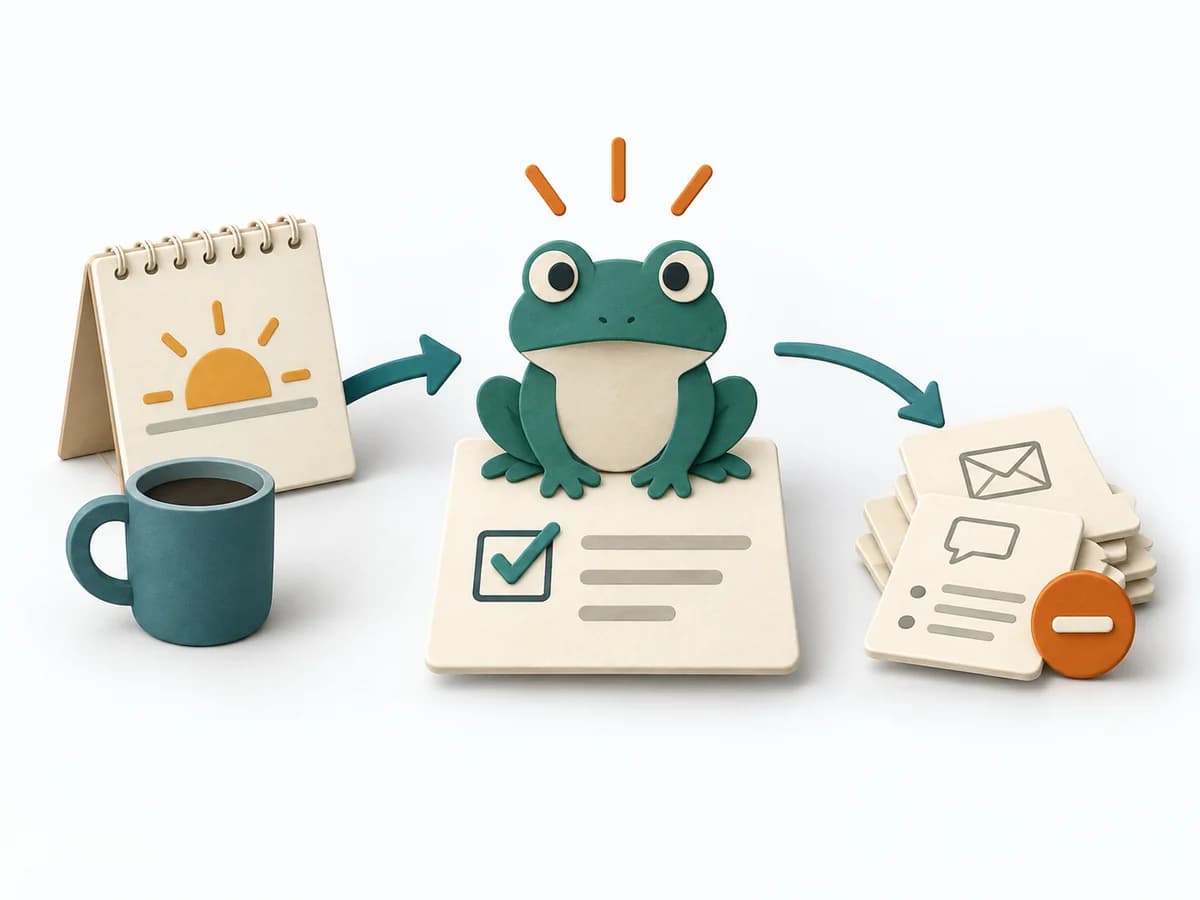 Operations Eat the Frog |
|---|---|---|---|---|
Purposedifferent | When a user journey falls apart across many touchpoints, customer journey mapping makes the experience visible as a coherent arc. Phases, emotions, and breaks become legible enough to prioritize critical moments deliberately. | With a restless workday full of too many open items, the method creates radical simplicity. It directs attention to a short sequence instead of a broad, still-open field. | When features need to be distinguished by their effect on satisfaction, it makes expectations and surprises comparable. It separates basic needs, performance contribution, and delight. | The method protects energy and attention for the task that creates the largest progress and is often postponed. |
Complexitydifferent | Medium | Low | Medium | Low |
Timedifferent | 2-4 h | 5-10 min daily | 1-2 Tage | 15-90 min daily |
Participantsdifferent | 4-10 | 1 | 10-50 | 1 |
Formatdifferent | Workshop | Async | Workshop + async | Async |
Outputdifferent | Journey Map, Pain-point List, Opportunity Backlog | Daily Priority List, Completion Notes | Kano Matrix, Feature Classes, Priority Themes | Priority Task, Completion Note, Daily Focus |
Tagsno overlap | JourneyServiceService design | PrioritizationProductivityExecution | SatisfactionPrioritizationCustomer | PrioritizationProductivityFocusExecution |