View methods side by side.
Choose up to four methods. Add them using the search and share the comparison by copying its link.
| Criterion |  UX Research Customer Journey Mapping |  Product Strategy ICE Scoring |  UX Design Customer Journey Canvas | 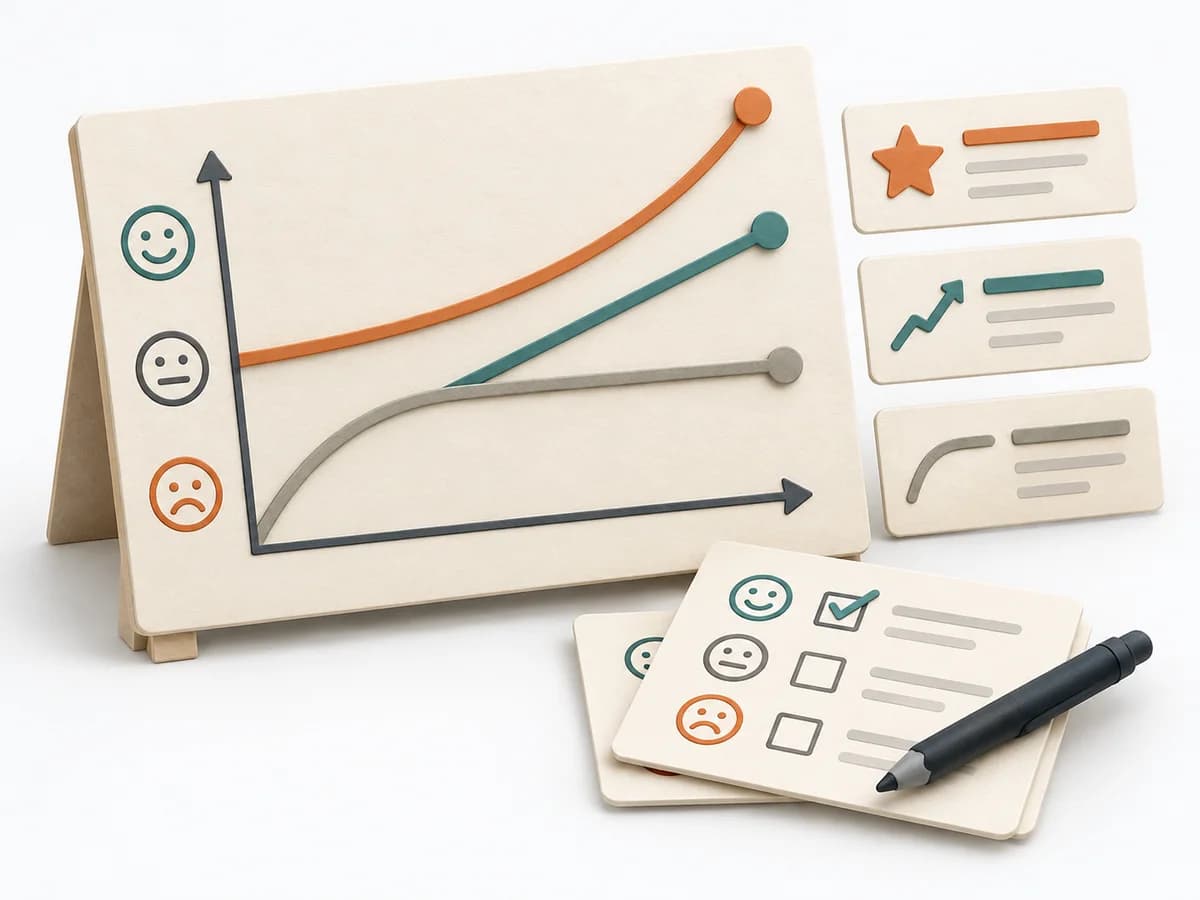 Product Discovery Kano Model |
|---|---|---|---|---|
Purposedifferent | When a user journey falls apart across many touchpoints, customer journey mapping makes the experience visible as a coherent arc. Phases, emotions, and breaks become legible enough to prioritize critical moments deliberately. | When ideas need sorting quickly, it condenses impact, confidence, and effort into one compact score. It connects customer value, product logic, and decision priorities. The result is captured as an ICE table and top-ideas list. | When a journey needs to be understood across several phases, it arranges experience, touchpoints, and opportunities into one picture. It makes gaps and friction along the user path clear. | When features need to be distinguished by their effect on satisfaction, it makes expectations and surprises comparable. It separates basic needs, performance contribution, and delight. |
Complexitydifferent | Medium | Low | Medium | Medium |
Timedifferent | 2-4 h | 30-60 min | 1-3 h | 1-2 Tage |
Participantsdifferent | 4-10 | 2-8 | 3-10 | 10-50 |
Formatdifferent | Workshop | Workshop + async | Workshop | Workshop + async |
Outputdifferent | Journey Map, Pain-point List, Opportunity Backlog | ICE Table, Top Idea List | Customer Journey Canvas, Pain Points, Experience Opportunities | Kano Matrix, Feature Classes, Priority Themes |
Tagsno overlap | JourneyServiceService design | PrioritizationScoringGrowthDecision | JourneyCustomerService designCanvas | SatisfactionPrioritizationCustomer |