View methods side by side.
Choose up to four methods. Add them using the search and share the comparison by copying its link.
| Criterion |  UX Research Customer Journey Mapping | 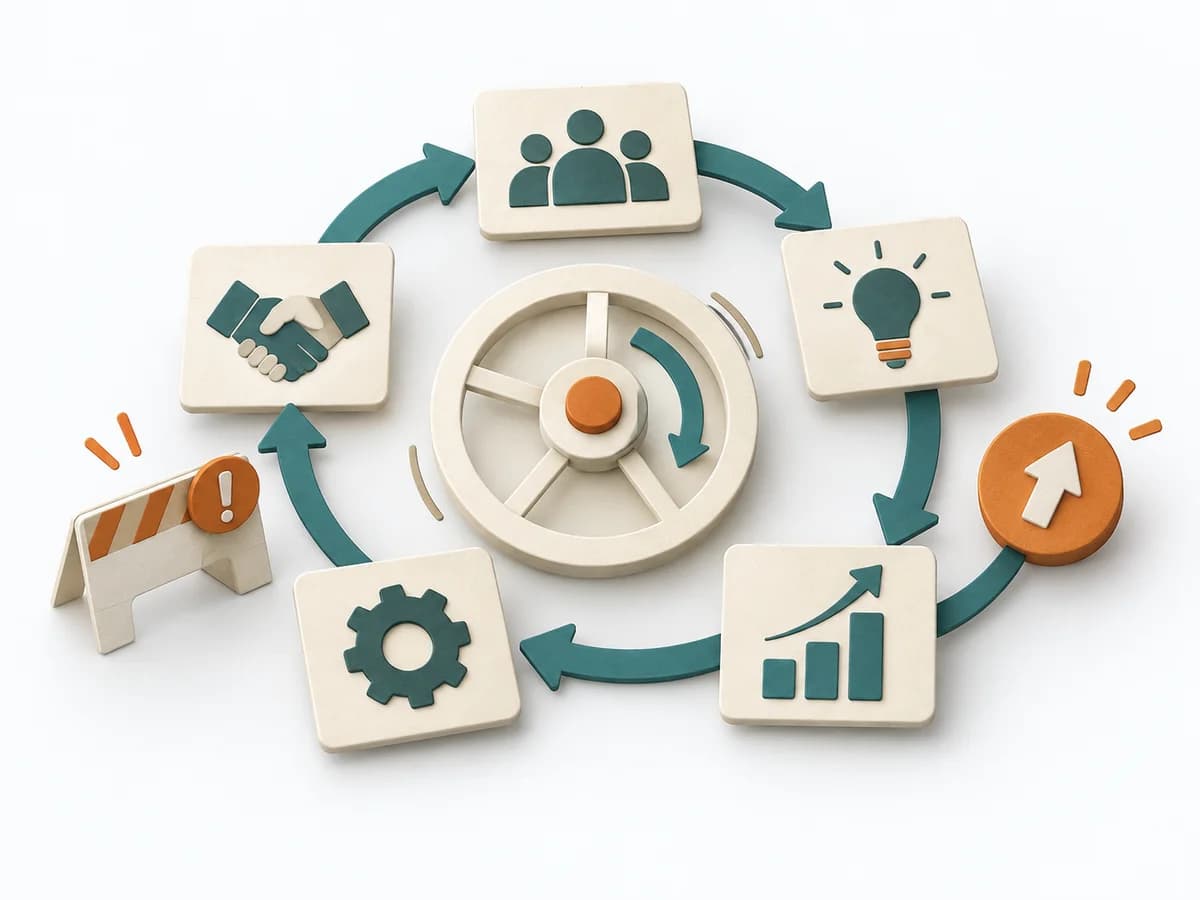 Growth Flywheel |  Growth Funnel Analysis |  Growth A/B Testing |
|---|---|---|---|---|
Purposedifferent | When a user journey falls apart across many touchpoints, customer journey mapping makes the experience visible as a coherent arc. Phases, emotions, and breaks become legible enough to prioritize critical moments deliberately. | Growth often breaks down where a reinforcing mechanism builds up too much friction. A Flywheel shows the cycle of value, repetition, and reinforcement meant to sustain growth. | When many visitors or users drop off along the way, the reason behind the number often stays hidden. Funnel Analysis exposes these transitions and makes visible exactly where the path collapses. | When two variants compete, discussions quickly decide by taste rather than effect. A/B Testing checks behavior under controlled conditions and separates real improvement from chance or expectation effects. |
Complexitydifferent | Medium | Medium | Medium | High |
Timedifferent | 2-4 h | 60-120 min | 1-3 h | 1-4 Wochen |
Participantsdifferent | 4-10 | 3-8 | 1-5 | 1-6 |
Formatdifferent | Workshop | Workshop | Async | Async |
Outputdifferent | Journey Map, Pain-point List, Opportunity Backlog | Flywheel Map, Friction Points, Growth Levers, Experiment Backlog | Funnel report, Drop-off analysis, Optimization hypotheses | Experiment results, Decision log, Learning summary |
Tagsno overlap | JourneyServiceService design | GrowthRetentionConversion | AnalyticsConversionGrowth | ExperimentsGrowthAnalyticsValidation |