View methods side by side.
Choose up to four methods. Add them using the search and share the comparison by copying its link.
| Criterion |  UX Research Customer Journey Mapping | 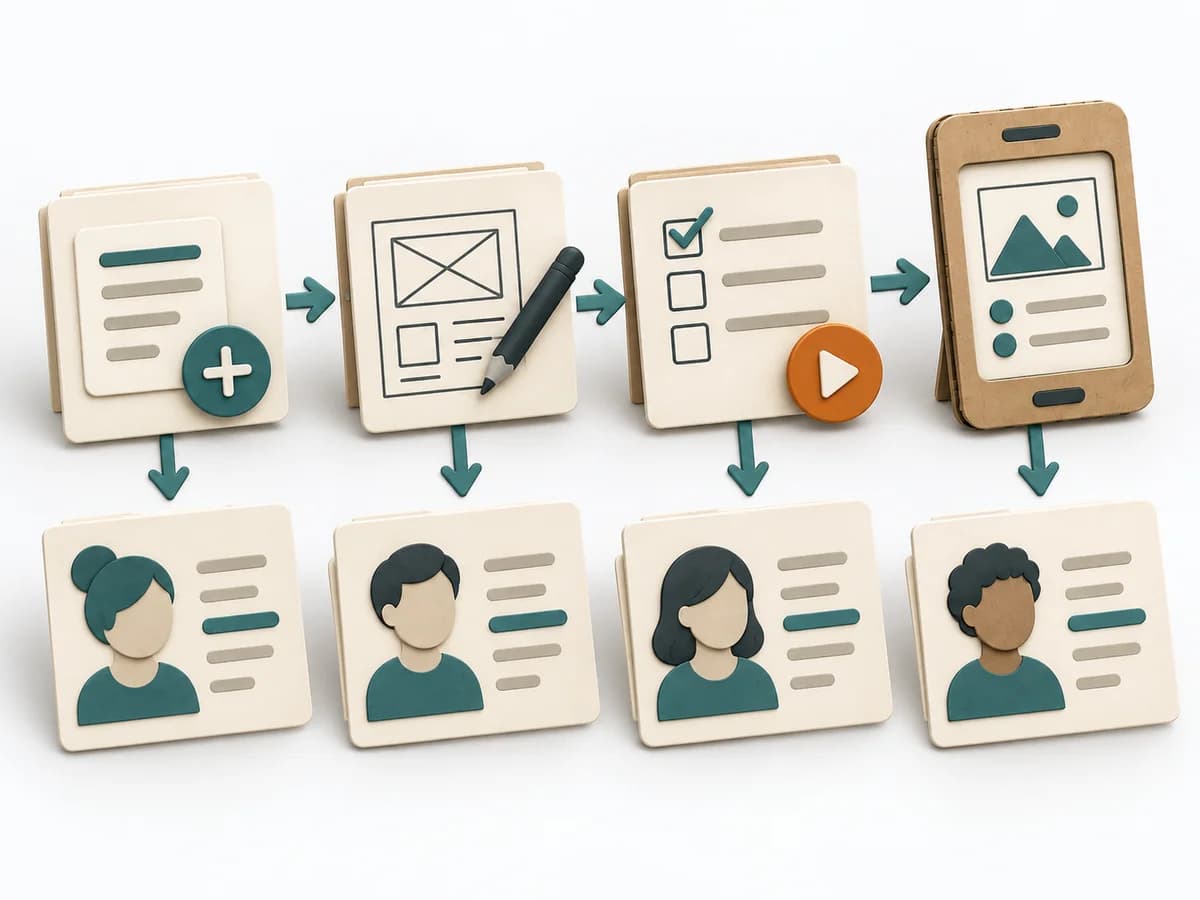 Knowledge Modeling Event Modeling |  Operations ABC Analysis |  Operations A3 Problem Solving |
|---|---|---|---|---|
Purposedifferent | When a user journey falls apart across many touchpoints, customer journey mapping makes the experience visible as a coherent arc. Phases, emotions, and breaks become legible enough to prioritize critical moments deliberately. | Event Modeling connects business workflows with commands, events, and views into one coherent mental model. It helps design behavior, UI, and technical slices from the same underlying logic. | With many similar objects of differing economic significance, the method prioritizes effort by effect. It separates what needs regular steering from what rarely needs attention. | For a complex deviation with several people involved, the method bundles problem, analysis, and decision onto one page. It creates a shared working space where causes, countermeasures, and follow-up fit together. |
Complexitydifferent | Medium | Medium | Low | Medium |
Timedifferent | 2-4 h | 2-6 h | 30-60 min | 45-90 min |
Participantsdifferent | 4-10 | 2-8 | 1-5 | 2-5 |
Formatdifferent | Workshop | Workshop + async | Async | Workshop + async |
Outputdifferent | Journey Map, Pain-point List, Opportunity Backlog | Event Model, UI Flow, Commands, Read Models | ABC Classification, Focus Rules, Control List | A3 Report, Action Plan, Root Cause Analysis |
Tagsno overlap | JourneyServiceService design | EventsBlueprintDomain-Driven DesignBehavior | PrioritizationOperationsPortfolio | LeanProblem solvingCoachingOperations |