View methods side by side.
Choose up to four methods. Add them using the search and share the comparison by copying its link.
| Criterion |  UX Research Customer Journey Mapping | 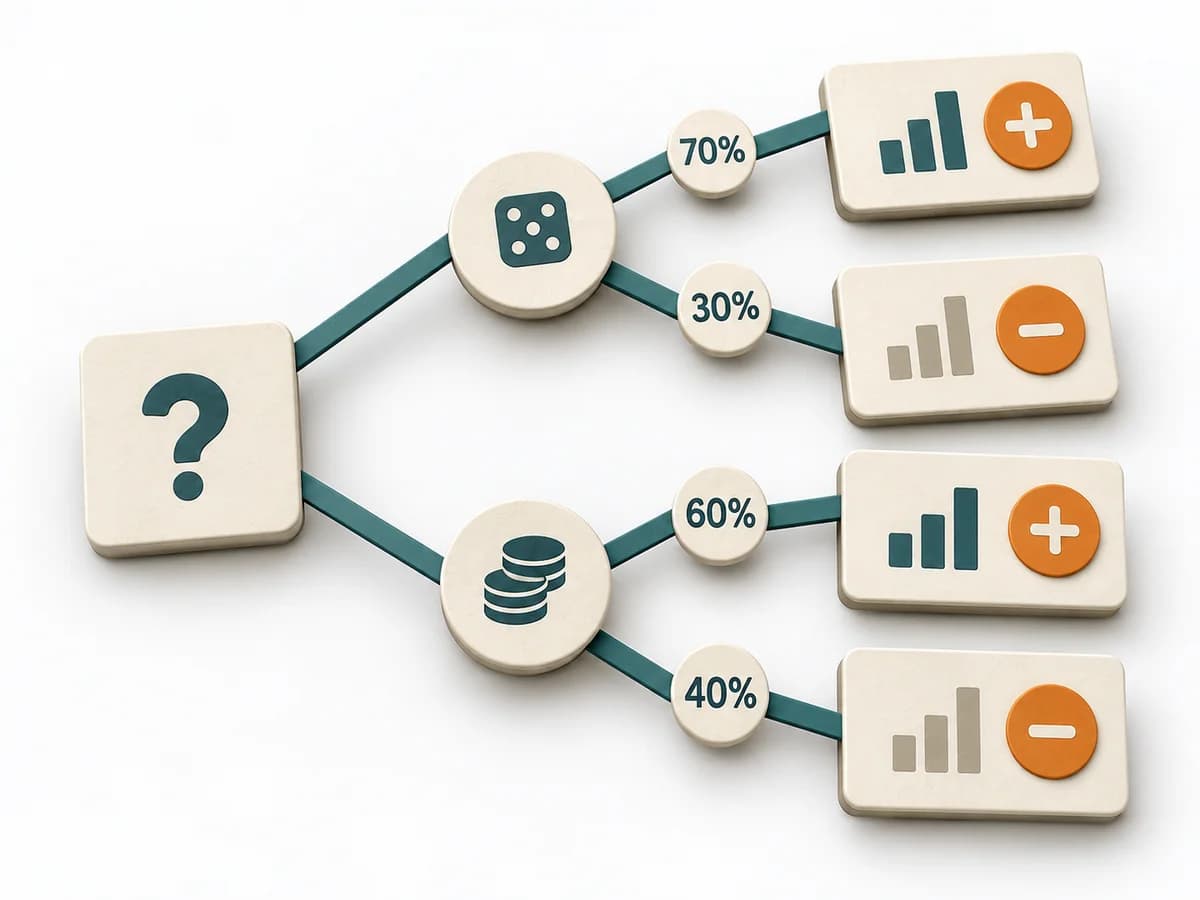 Decision Making Decision Tree |  Growth A/B Testing | 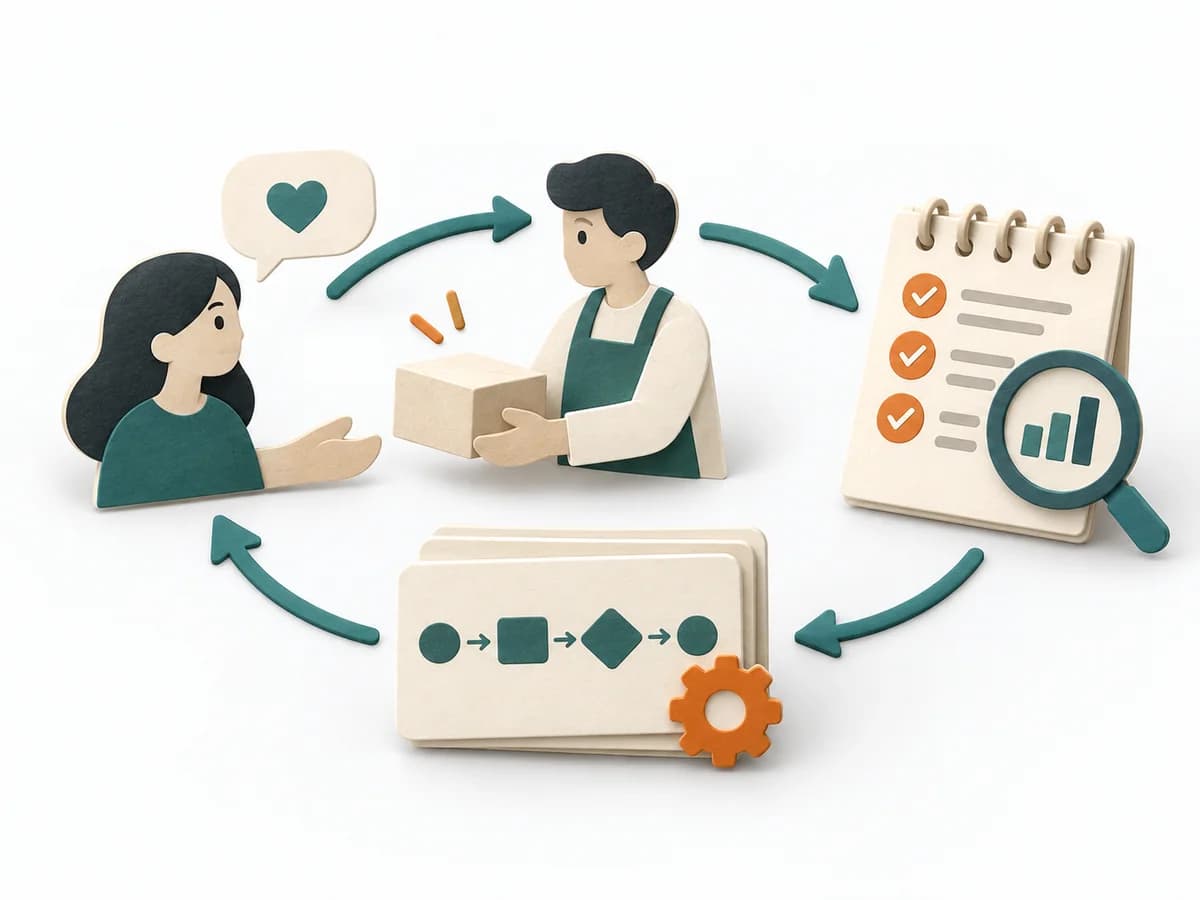 Product Discovery Concierge MVP |
|---|---|---|---|---|
Purposedifferent | When a user journey falls apart across many touchpoints, customer journey mapping makes the experience visible as a coherent arc. Phases, emotions, and breaks become legible enough to prioritize critical moments deliberately. | For decisions with follow-on paths and dependencies, a linear comparison is often not enough. A Decision Tree shows how options branch under conditions and which consequences hang on each branch. | When two variants compete, discussions quickly decide by taste rather than effect. A/B Testing checks behavior under controlled conditions and separates real improvement from chance or expectation effects. | When an idea can first fail or grow through genuine hands-on support, it relies on manual work instead of automation. It shows whether user value holds up even under manual execution. |
Complexitydifferent | Medium | Medium | High | Medium |
Timedifferent | 2-4 h | 30-90 min | 1-4 Wochen | 1-4 Wochen |
Participantsdifferent | 4-10 | 1-6 | 1-6 | 3-10 Kunden |
Formatdifferent | Workshop | Workshop + async | Async | Workshop + async |
Outputdifferent | Journey Map, Pain-point List, Opportunity Backlog | Decision Tree, Option Map, Assumption List | Experiment results, Decision log, Learning summary | Concierge Learnings, Service Blueprint, MVP Risks |
Tagsno overlap | JourneyServiceService design | DecisionTreeOptions | ExperimentsGrowthAnalyticsValidation | MVPValidationServiceDiscovery |