View methods side by side.
Choose up to four methods. Add them using the search and share the comparison by copying its link.
| Criterion |  UX Research Customer Journey Mapping |  Delivery Cost of Delay | 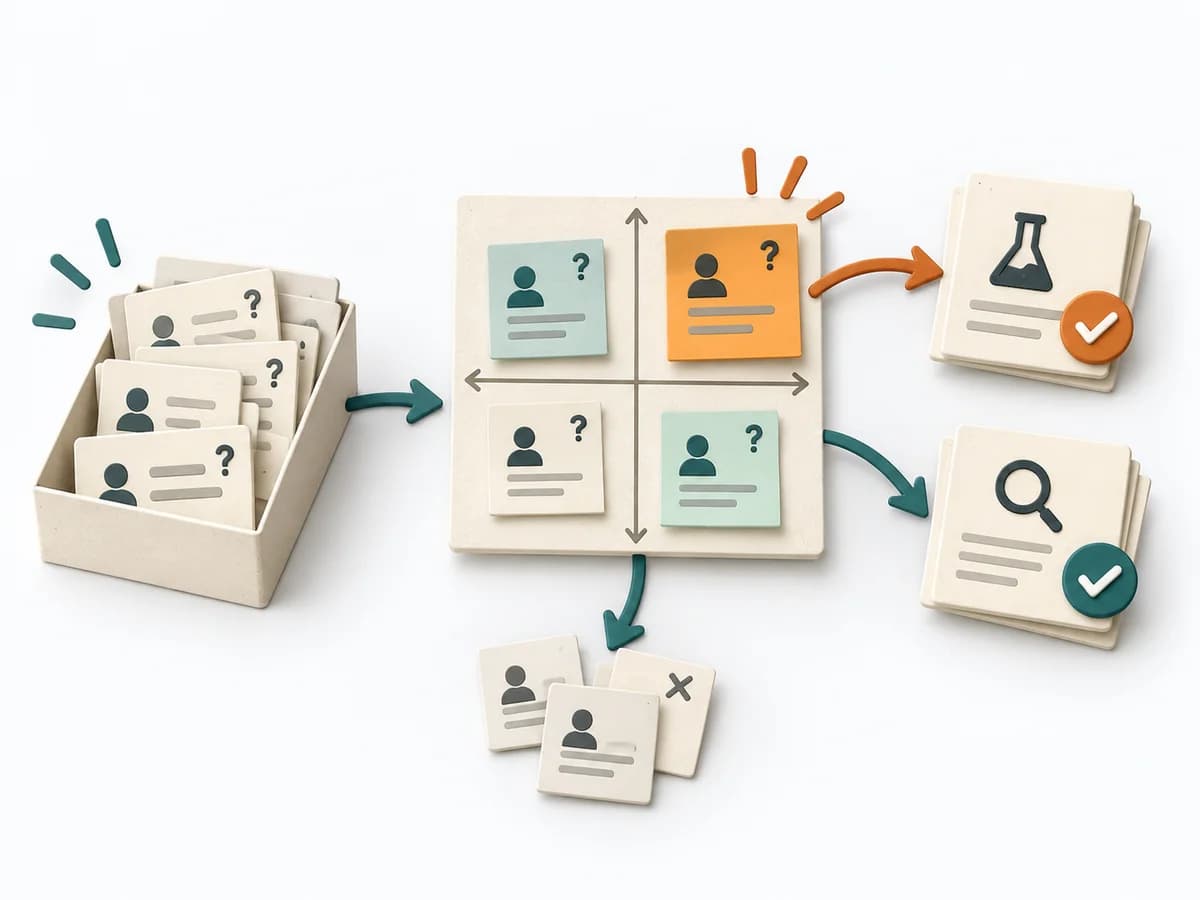 Decision Making Assumption Surfacing | 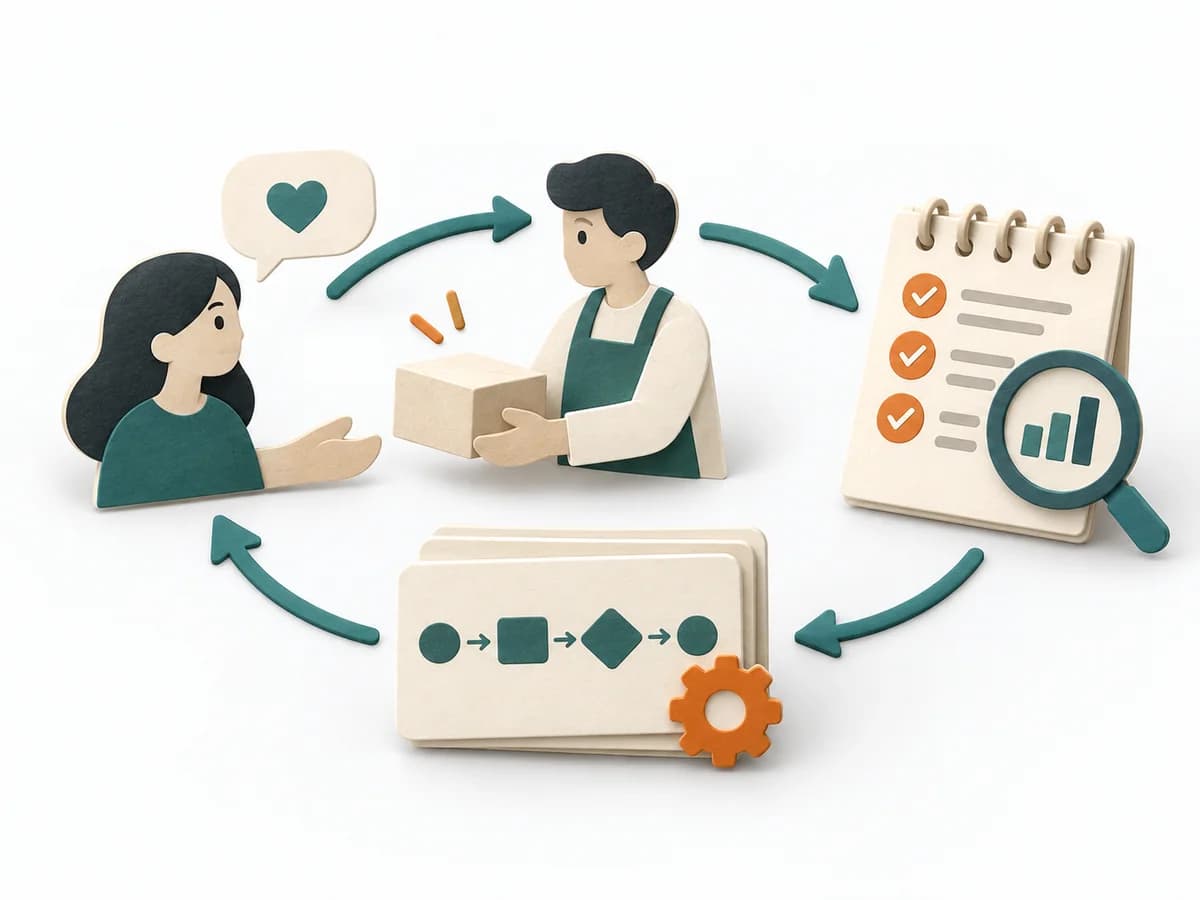 Product Discovery Concierge MVP |
|---|---|---|---|---|
Purposedifferent | When a user journey falls apart across many touchpoints, customer journey mapping makes the experience visible as a coherent arc. Phases, emotions, and breaks become legible enough to prioritize critical moments deliberately. | Helps clarify scope, order, and delivery flow in concrete terms. It makes work, constraints, and sequence manageable. The result is captured as a Cost of Delay table and prioritization sequence. | Plans often contain assumptions that were never openly stated and remain dangerous precisely because of that. Assumption Surfacing makes these silent premises visible and prioritizes which of them carry the initiative or could sink it. | When an idea can first fail or grow through genuine hands-on support, it relies on manual work instead of automation. It shows whether user value holds up even under manual execution. |
Complexitydifferent | Medium | High | Low | Medium |
Timedifferent | 2-4 h | 90-180 min | 45-90 min | 1-4 Wochen |
Participantsdifferent | 4-10 | 3-8 | 2-8 | 3-10 Kunden |
Formatdifferent | Workshop | Workshop | Workshop + async | Workshop + async |
Outputdifferent | Journey Map, Pain-point List, Opportunity Backlog | CoD Table, Prioritization Sequence | Assumption List, Critical Assumptions, Learning Plan | Concierge Learnings, Service Blueprint, MVP Risks |
Tagsno overlap | JourneyServiceService design | PrioritizationDeliveryEconomicsDecision | AssumptionsRiskDecisionDiscovery | MVPValidationServiceDiscovery |