View methods side by side.
Choose up to four methods. Add them using the search and share the comparison by copying its link.
| Criterion |  UX Research Customer Journey Mapping | 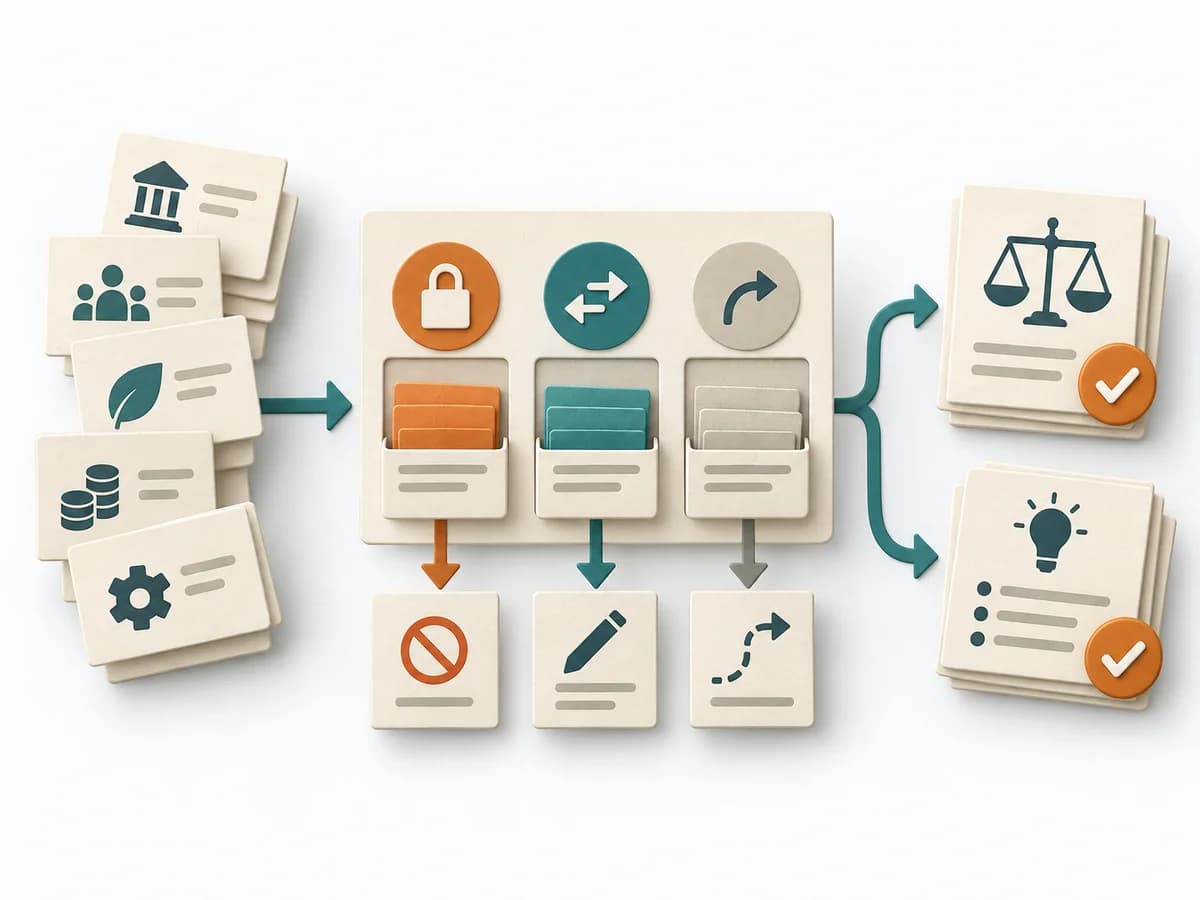 Decision Making Constraint Analysis |  UX Design Service Blueprinting | 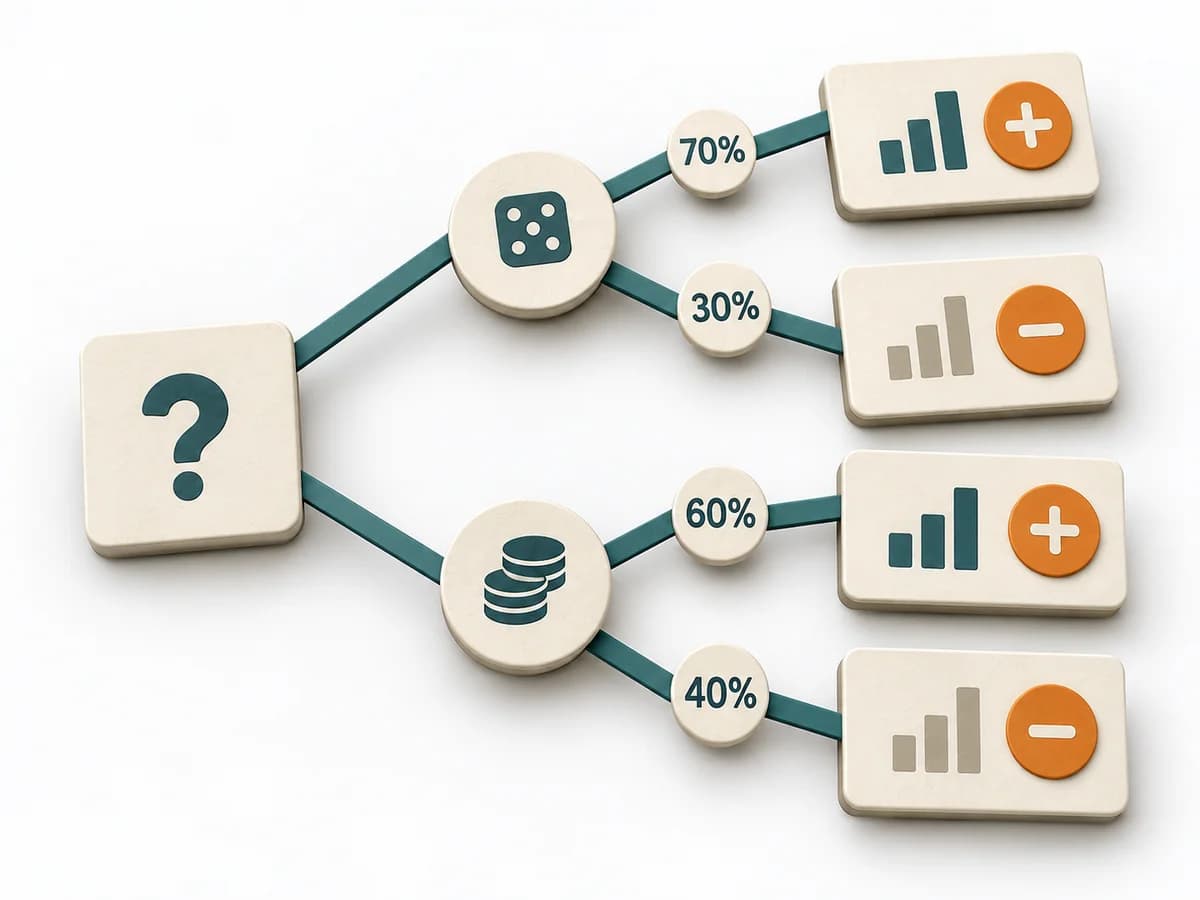 Decision Making Decision Tree |
|---|---|---|---|---|
Purposedifferent | When a user journey falls apart across many touchpoints, customer journey mapping makes the experience visible as a coherent arc. Phases, emotions, and breaks become legible enough to prioritize critical moments deliberately. | When an initiative stalls, the limit often lies not in the idea but in hard or soft boundary conditions. Constraint Analysis separates these limits and shows which of them can actually be shaped. | When a service experience is spread across several touchpoints, it brings frontstage and backstage together. It shows where user contact and internal responsibility must fit. | For decisions with follow-on paths and dependencies, a linear comparison is often not enough. A Decision Tree shows how options branch under conditions and which consequences hang on each branch. |
Complexitydifferent | Medium | Low | High | Medium |
Timedifferent | 2-4 h | 30-90 min | 0.5-2 Tage | 30-90 min |
Participantsdifferent | 4-10 | 2-8 | 6-12 | 1-6 |
Formatdifferent | Workshop | Workshop + async | Workshop | Workshop + async |
Outputdifferent | Journey Map, Pain-point List, Opportunity Backlog | Constraint List, Hard/Soft Classification, Option Impact Notes, Decision Boundaries | Service Blueprint, Fail Points, Ownership Map | Decision Tree, Option Map, Assumption List |
Tagsno overlap | JourneyServiceService design | ConstraintsDecisionPlanningOptions | Service designOperationsJourneyBlueprint | DecisionTreeOptions |