View methods side by side.
Choose up to four methods. Add them using the search and share the comparison by copying its link.
| Criterion |  UX Research Customer Journey Mapping | 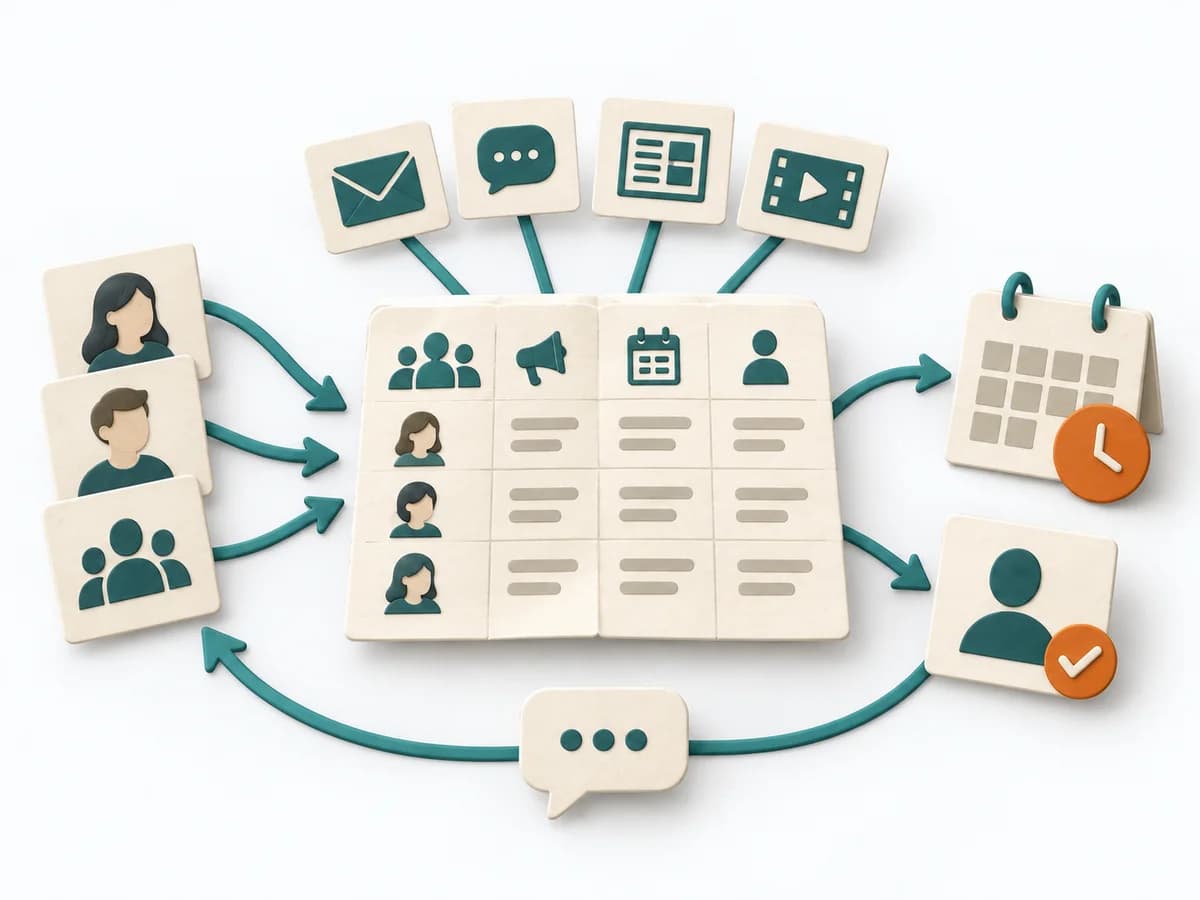 Delivery Communication Plan | 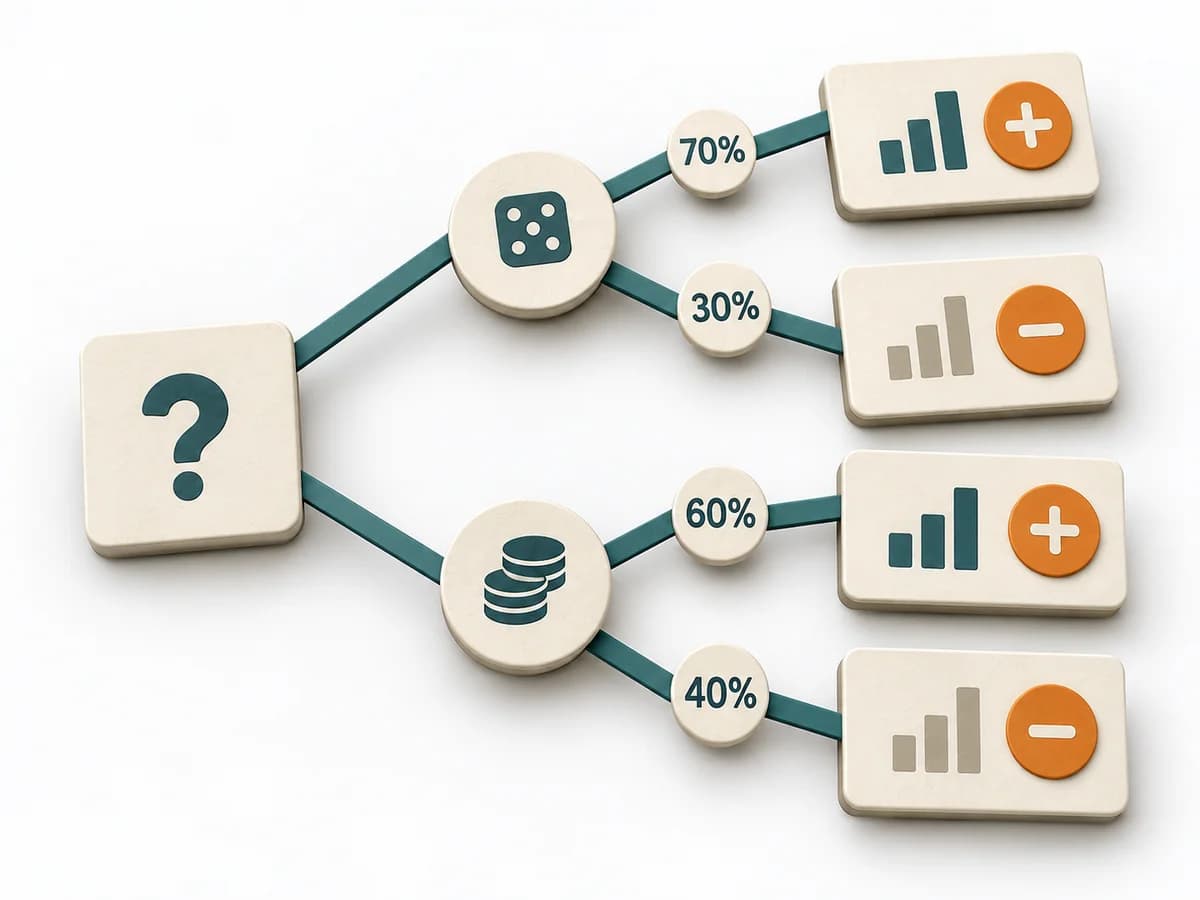 Decision Making Decision Tree |  Delivery Cost of Delay |
|---|---|---|---|---|
Purposedifferent | When a user journey falls apart across many touchpoints, customer journey mapping makes the experience visible as a coherent arc. Phases, emotions, and breaks become legible enough to prioritize critical moments deliberately. | When many people need to be informed in parallel and messages would otherwise arrive unevenly or too late, a Communication Plan orders communication reliably. Channels, audiences, and cadences interlock so important information doesn't get lost. | For decisions with follow-on paths and dependencies, a linear comparison is often not enough. A Decision Tree shows how options branch under conditions and which consequences hang on each branch. | Helps clarify scope, order, and delivery flow in concrete terms. It makes work, constraints, and sequence manageable. The result is captured as a Cost of Delay table and prioritization sequence. |
Complexitydifferent | Medium | Low | Medium | High |
Timedifferent | 2-4 h | 45-90 min | 30-90 min | 90-180 min |
Participantsdifferent | 4-10 | 2-6 | 1-6 | 3-8 |
Formatdifferent | Workshop | Workshop + async | Workshop + async | Workshop |
Outputdifferent | Journey Map, Pain-point List, Opportunity Backlog | Communication Plan, Channel Matrix, Message Cadence | Decision Tree, Option Map, Assumption List | CoD Table, Prioritization Sequence |
Tagsno overlap | JourneyServiceService design | CommunicationStakeholdersDeliveryPlanning | DecisionTreeOptions | PrioritizationDeliveryEconomicsDecision |