View methods side by side.
Choose up to four methods. Add them using the search and share the comparison by copying its link.
| Criterion |  Systems Thinking Iceberg Model | 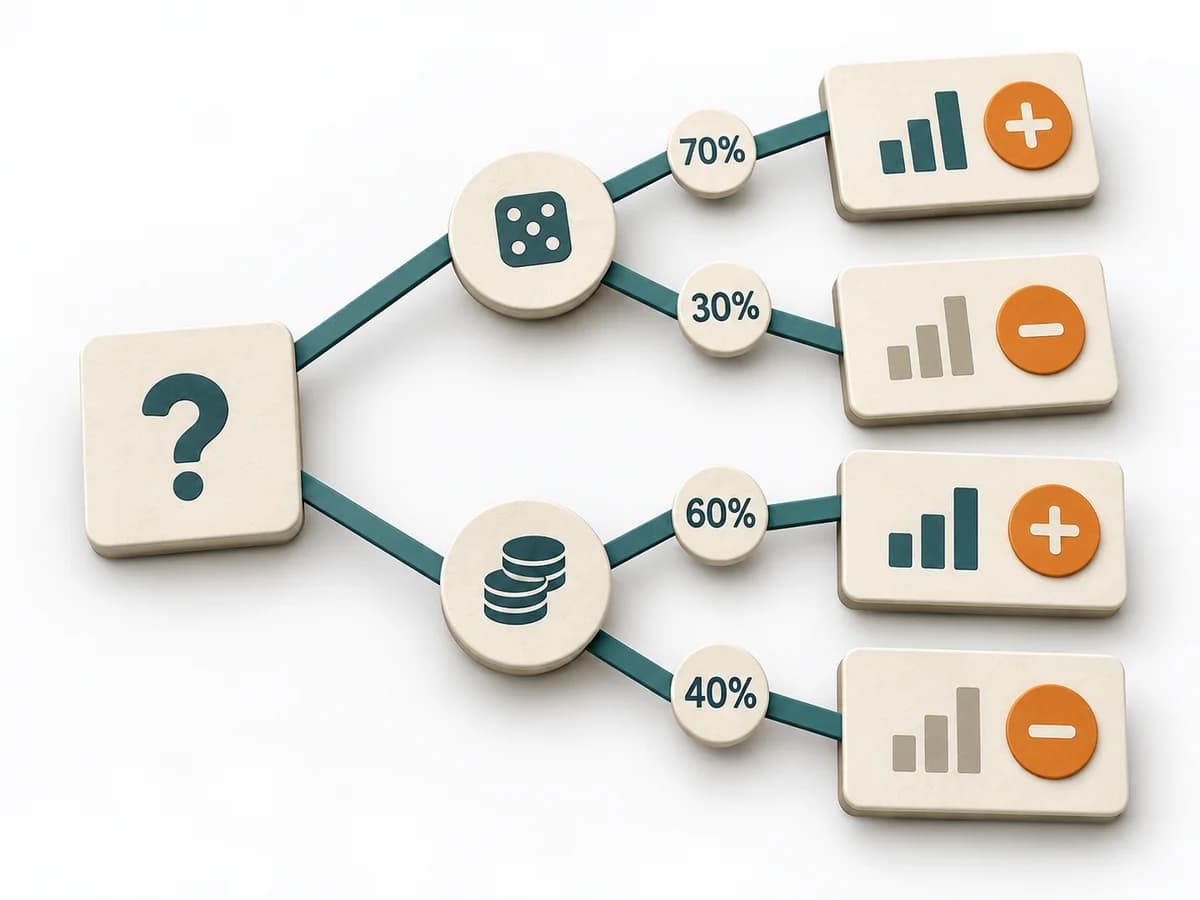 Decision Making Decision Tree | 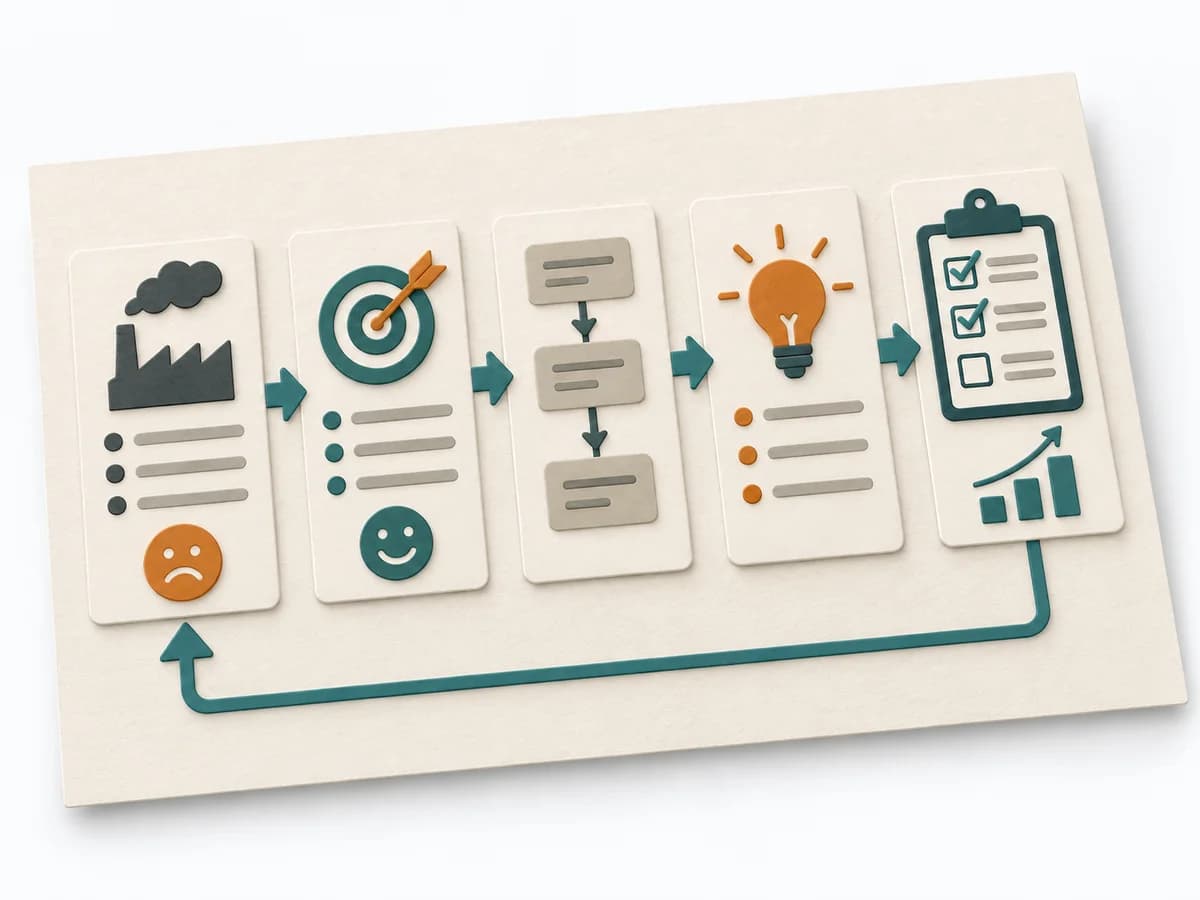 Operations A3 Problem Solving |  Systems Thinking Behavior Over Time Graph |
|---|---|---|---|---|
Purposedifferent | The Iceberg Model separates visible events from patterns, structures, and mental models. This turns a single observation into a deeper understanding of why a problem keeps recurring. | For decisions with follow-on paths and dependencies, a linear comparison is often not enough. A Decision Tree shows how options branch under conditions and which consequences hang on each branch. | For a complex deviation with several people involved, the method bundles problem, analysis, and decision onto one page. It creates a shared working space where causes, countermeasures, and follow-up fit together. | A Behavior Over Time Graph shows how a metric or observation develops over time. The method makes trends, breaks, and recurring patterns visible that get lost in snapshots. |
Complexitydifferent | Low | Medium | Medium | Low |
Timedifferent | 30-60 min | 30-90 min | 45-90 min | 20-45 min |
Participantsdifferent | 2-10 | 1-6 | 2-5 | 1-10 |
Formatsame | Workshop + async | Workshop + async | Workshop + async | Workshop + async |
Outputdifferent | Iceberg Worksheet, Pattern Notes, Intervention Ideas | Decision Tree, Option Map, Assumption List | A3 Report, Action Plan, Root Cause Analysis | Behavior Over Time Graph, Trend Hypotheses, Key Events |
Tagsno overlap | Systems thinkingRoot causePatterns | DecisionTreeOptions | LeanProblem solvingCoachingOperations | Systems thinkingPatternsDynamics |