View methods side by side.
Choose up to four methods. Add them using the search and share the comparison by copying its link.
| Criterion | 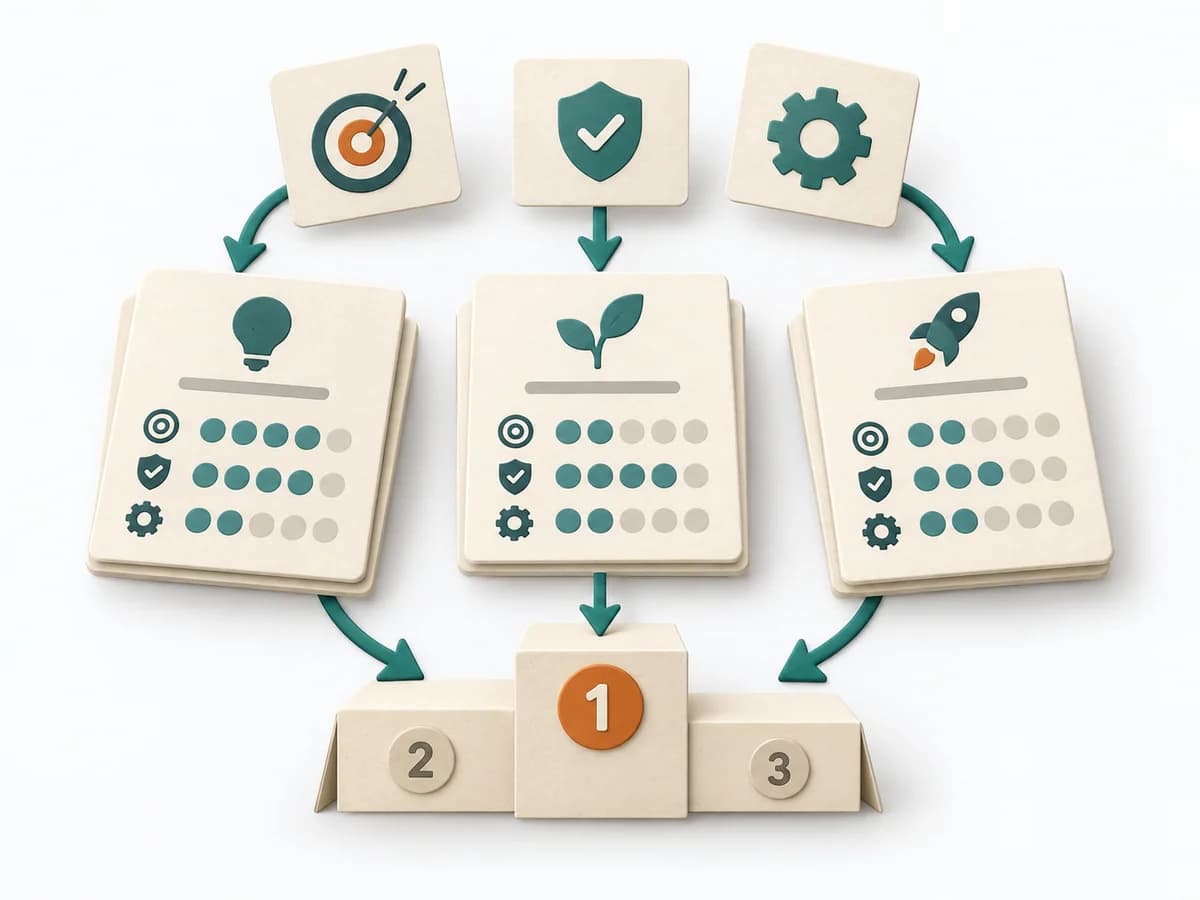 Product Strategy ICE Scoring | 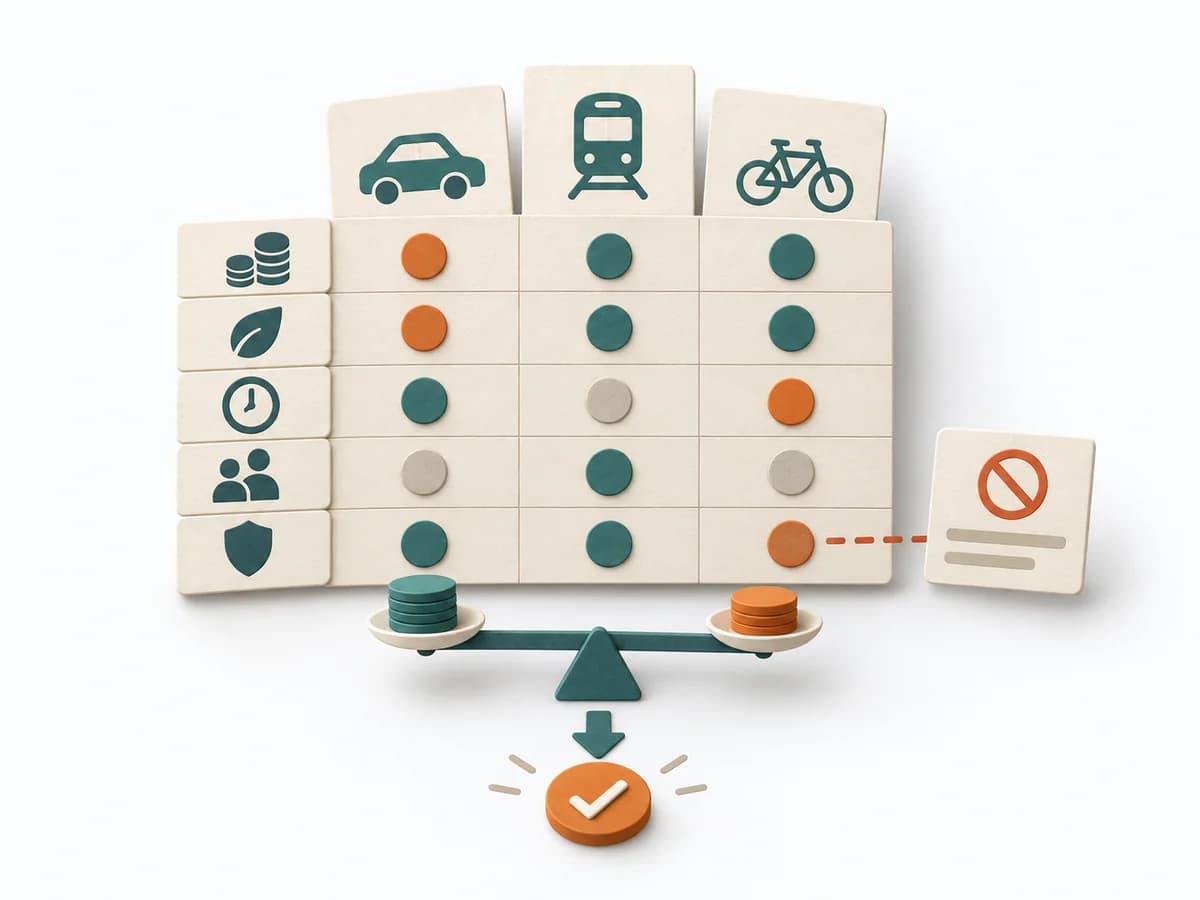 Decision Making Trade-off Analysis |  Growth A/B Testing | 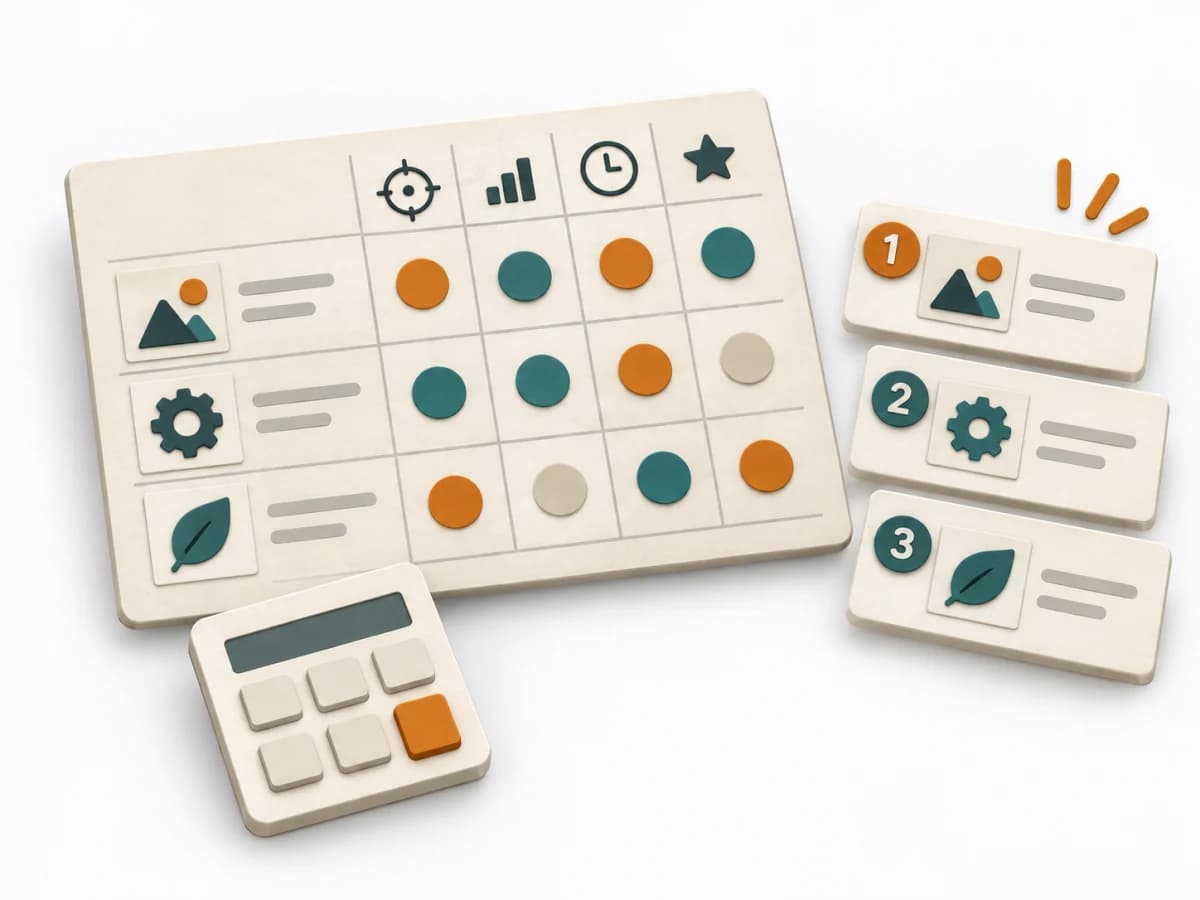 Product Strategy RICE Scoring |
|---|---|---|---|---|
Purposedifferent | When ideas need sorting quickly, it condenses impact, confidence, and effort into one compact score. It connects customer value, product logic, and decision priorities. The result is captured as an ICE table and top-ideas list. | With limited resources, quality, speed, cost, and risk almost always compete with each other. Trade-off Analysis makes these tensions explicit and prevents decisions from producing hidden side effects. | When two variants compete, discussions quickly decide by taste rather than effect. A/B Testing checks behavior under controlled conditions and separates real improvement from chance or expectation effects. | When many initiatives compete for the same resources, it brings reach, impact, confidence, and effort into one shared ranking. It makes prioritization economically connectable. |
Complexitydifferent | Low | Medium | High | Medium |
Timedifferent | 30-60 min | 45-120 min | 1-4 Wochen | 60-90 min |
Participantsdifferent | 2-8 | 2-8 | 1-6 | 2-10 |
Formatdifferent | Workshop + async | Workshop + async | Async | Workshop + async |
Outputdifferent | ICE Table, Top Idea List | Trade-off Matrix, Criteria List, Decision Rationale, Accepted Downsides | Experiment results, Decision log, Learning summary | RICE Scores, Ranked List, Assumption Log |
Tagsno overlap | PrioritizationScoringGrowthDecision | TradeoffsDecisionCriteriaOptions | ExperimentsGrowthAnalyticsValidation | PrioritizationScoringRoadmapTradeoffs |