View methods side by side.
Choose up to four methods. Add them using the search and share the comparison by copying its link.
| Criterion | 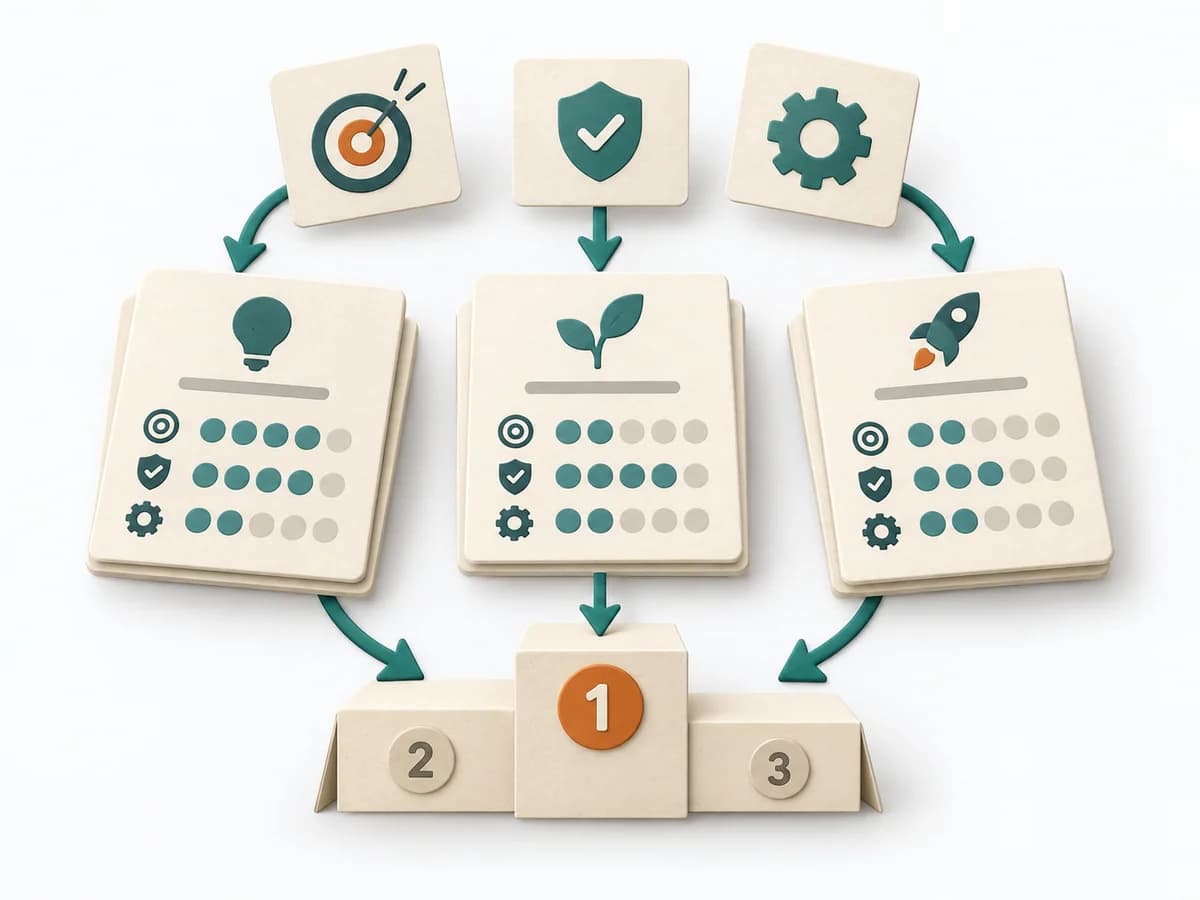 Product Strategy ICE Scoring | 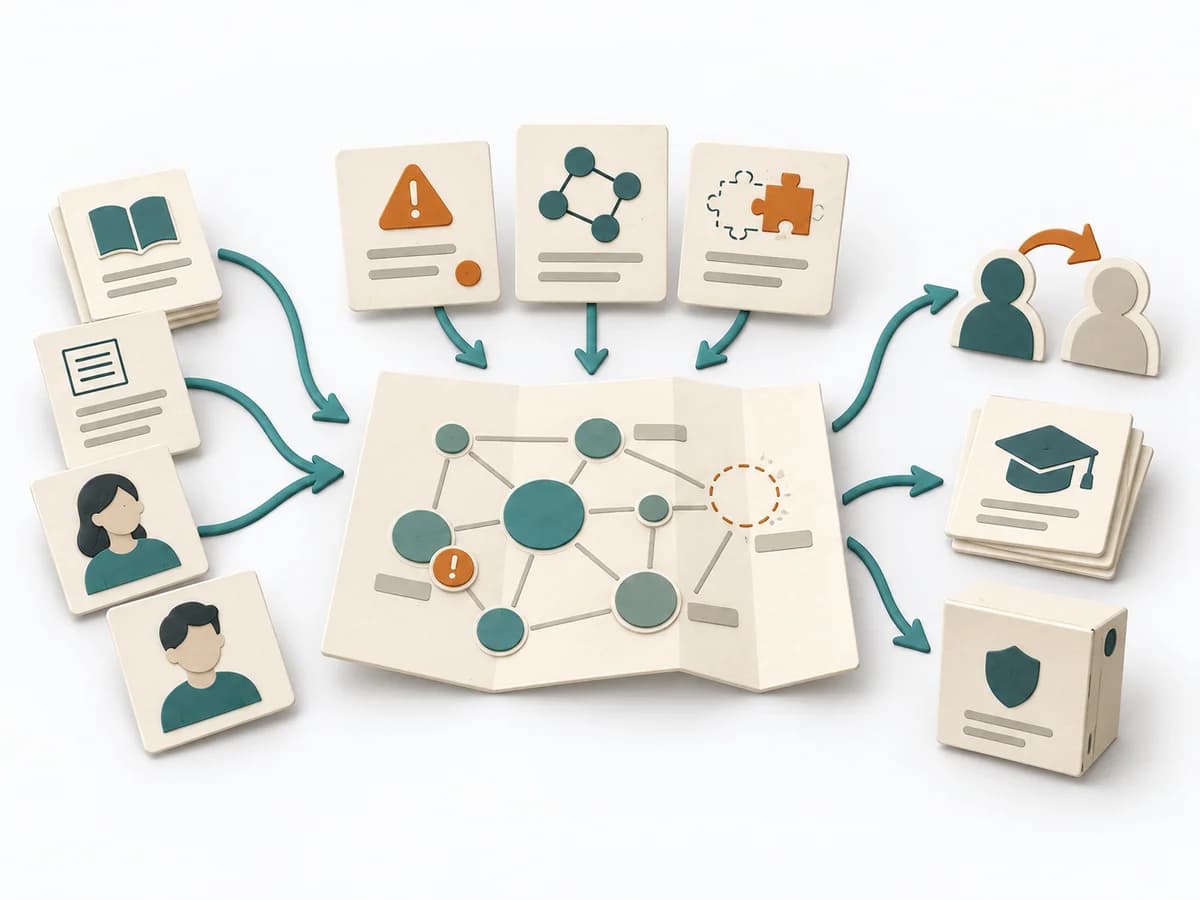 Knowledge Modeling Knowledge Mapping | 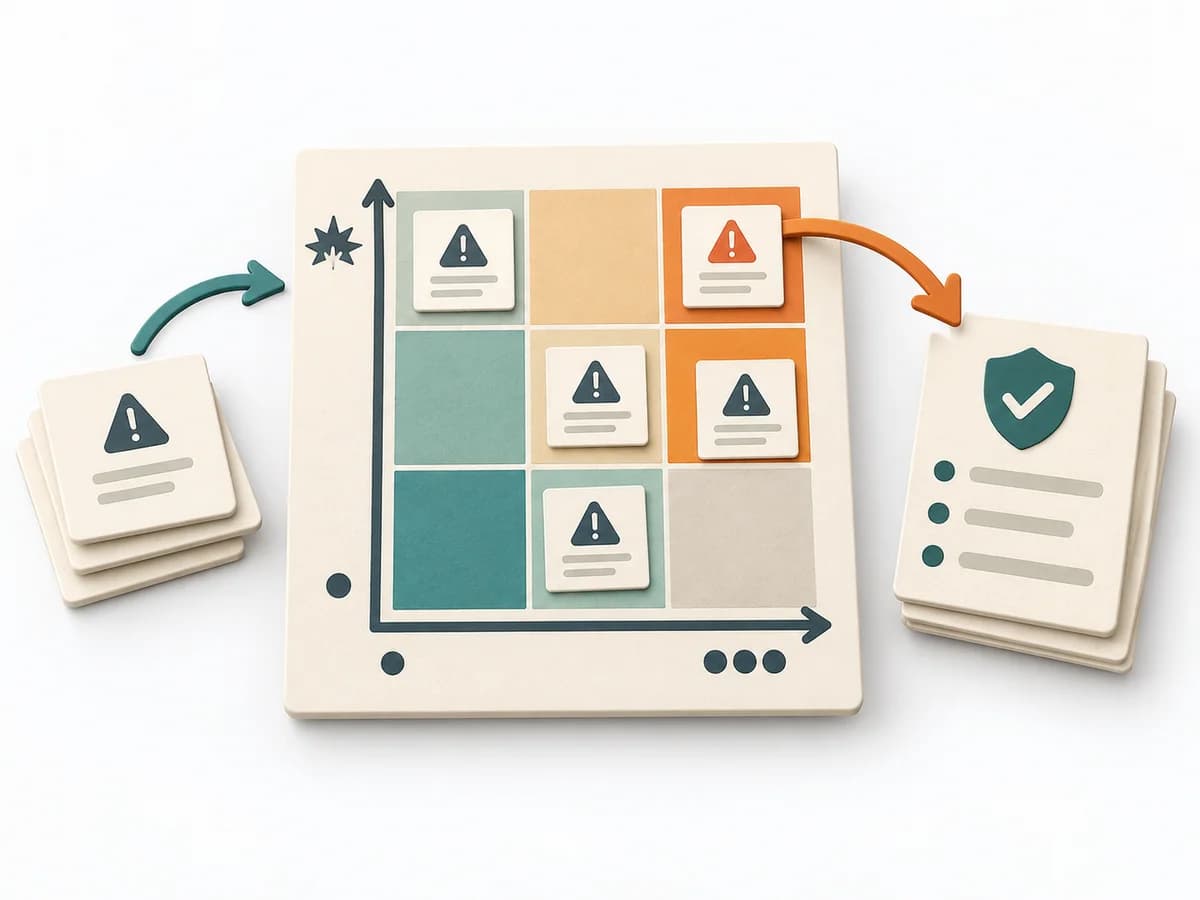 Decision Making Risk Matrix | 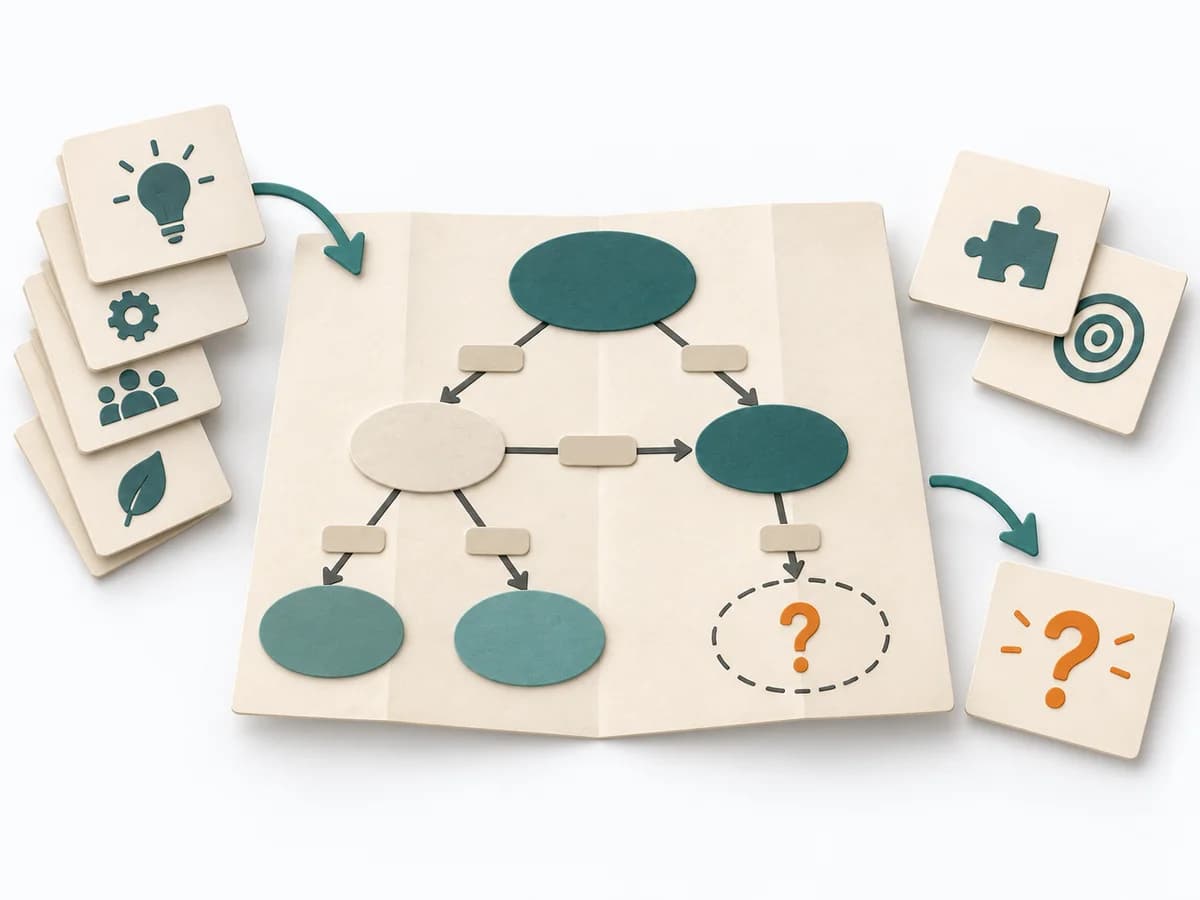 Knowledge Modeling Concept Mapping |
|---|---|---|---|---|
Purposedifferent | When ideas need sorting quickly, it condenses impact, confidence, and effort into one compact score. It connects customer value, product logic, and decision priorities. The result is captured as an ICE table and top-ideas list. | Knowledge Mapping makes knowledge, gaps, and transfer paths visible across a field. It fits when expertise should not just exist but also be findable and transferable. | When a project faces many possible disruptions, it quickly becomes unclear which risks deserve attention first. It separates options, evaluation criteria, and open risks. The result is captured as a Risk Matrix and a Top Risk List. | Concept Mapping arranges terms and relationships in a network that makes subject-matter connections tangible. It fits when a topic needs to be understood structurally rather than linearly. |
Complexitydifferent | Low | Medium | Low | Medium |
Timedifferent | 30-60 min | 1-3 h | 30-60 min | 1-2 h |
Participantsdifferent | 2-8 | 3-12 | 3-10 | 1-8 |
Formatdifferent | Workshop + async | Workshop | Workshop + async | Workshop + async |
Outputdifferent | ICE Table, Top Idea List | Knowledge Map, Critical Knowledge Areas, Transfer Plan | Risk Matrix, Top Risk List | Concept Map, Relationship Labels, Knowledge Gaps |
Tagsno overlap | PrioritizationScoringGrowthDecision | KnowledgeMappingRisk | RiskDecisionPrioritizationAssessment | KnowledgeConceptsMappingSensemaking |