View methods side by side.
Choose up to four methods. Add them using the search and share the comparison by copying its link.
| Criterion | 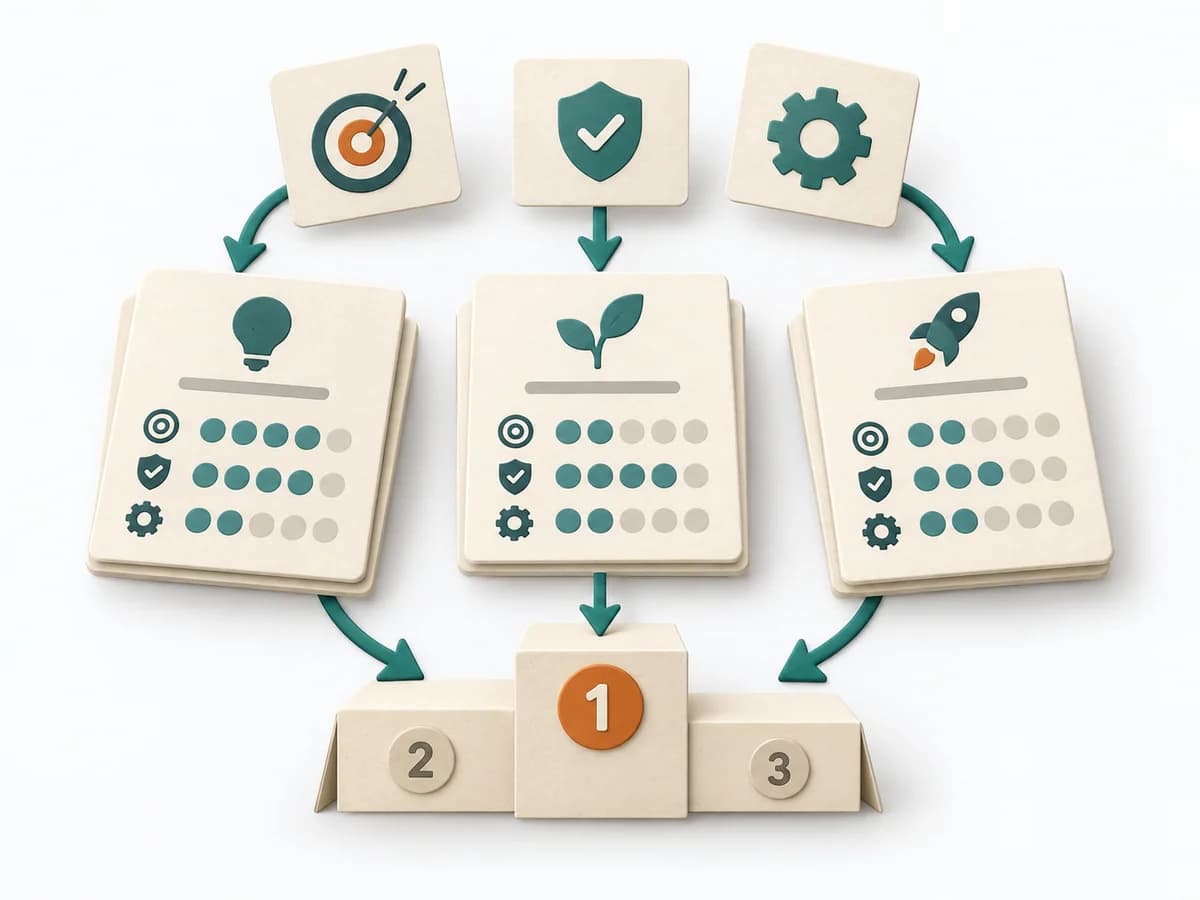 Product Strategy ICE Scoring |  Operations Failure Mode and Effects Analysis |  Operations Root Cause Analysis |  Operations Kepner-Tregoe |
|---|---|---|---|---|
Purposedifferent | When ideas need sorting quickly, it condenses impact, confidence, and effort into one compact score. It connects customer value, product logic, and decision priorities. The result is captured as an ICE table and top-ideas list. | For a process, product, or service with noticeable failure risks, the method assesses possible failure modes in advance. It directs attention to combinations of occurrence, effect, and detectability. | When a problem keeps recurring and the cause stays unclear, the method exposes the underlying mechanism. It separates symptom, guess, and robust explanation from one another. | For a disturbance that's hard to pin down, the method cleanly separates problem, cause, and decision. It reduces mixing when symptoms allow several interpretations. |
Complexitydifferent | Low | High | Medium | High |
Timedifferent | 30-60 min | 2-6 h | 1-4 h | 2-8 h |
Participantsdifferent | 2-8 | 3-10 | 3-8 | 2-8 |
Formatdifferent | Workshop + async | Workshop | Workshop + async | Workshop + async |
Outputdifferent | ICE Table, Top Idea List | FMEA Table, Risk Priority, Mitigation Actions | Problem Statement, Cause Hypotheses, Confirmed Causes, Action Plan | Problem Analysis, Decision Analysis, Risk Plan |
Tagsno overlap | PrioritizationScoringGrowthDecision | RiskQualityOperationsRoot cause | Root causeProblem solvingQualityIncident | Problem solvingRoot causeDecisionOperations |