View methods side by side.
Choose up to four methods. Add them using the search and share the comparison by copying its link.
| Criterion |  Product Strategy ICE Scoring |  Product Discovery Assumption Mapping | 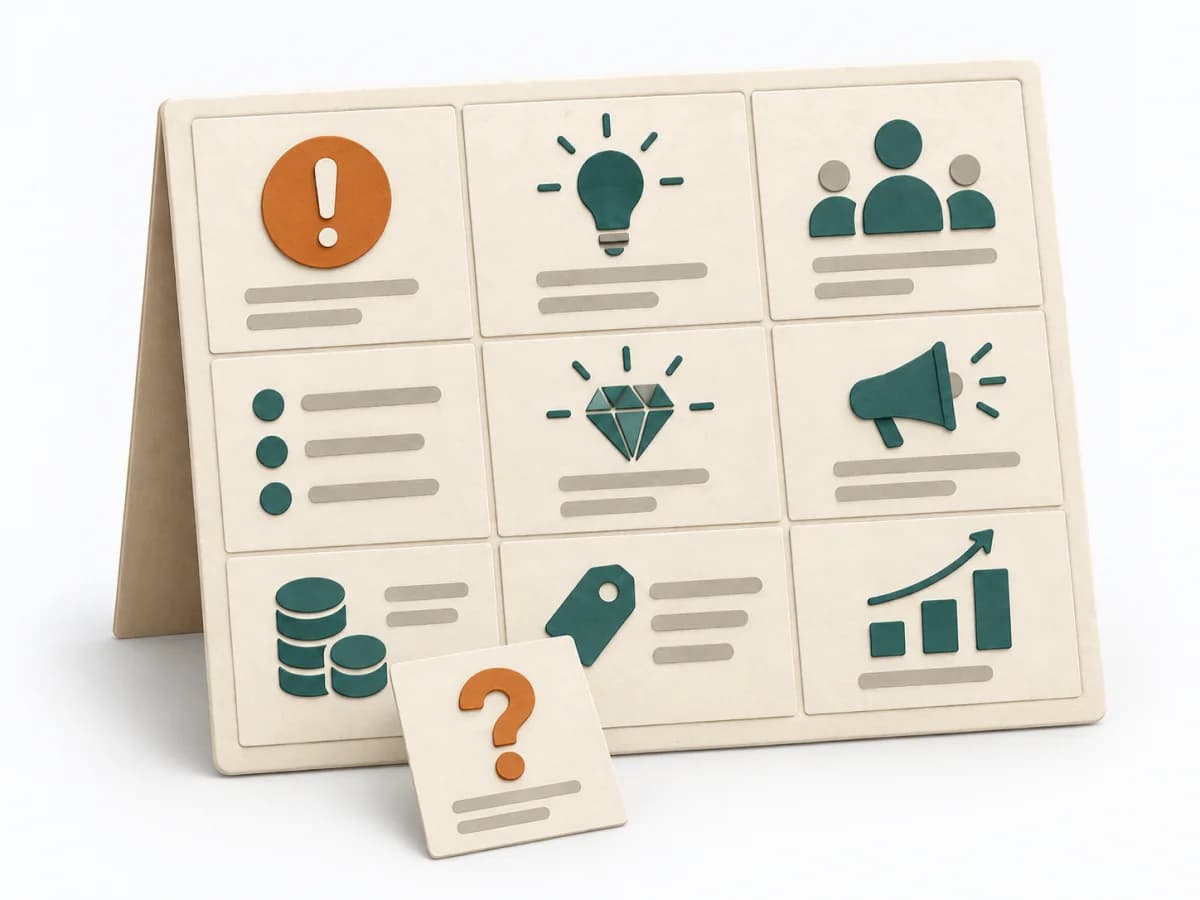 Product Strategy Lean Canvas |  Growth A/B Testing |
|---|---|---|---|---|
Purposedifferent | When ideas need sorting quickly, it condenses impact, confidence, and effort into one compact score. It connects customer value, product logic, and decision priorities. The result is captured as an ICE table and top-ideas list. | When assumptions still sit unordered in the room, it weighs uncertainty against leverage. It makes visible which hypotheses should be checked first. | When an early product bet still has too many open points, it brings target group, problem, and assumptions into a single view. It condenses the idea so core risks become nameable. | When two variants compete, discussions quickly decide by taste rather than effect. A/B Testing checks behavior under controlled conditions and separates real improvement from chance or expectation effects. |
Complexitydifferent | Low | Medium | Medium | High |
Timedifferent | 30-60 min | 45-60 min | 45-90 min | 1-4 Wochen |
Participantsdifferent | 2-8 | 2-8 | 1-6 | 1-6 |
Formatdifferent | Workshop + async | Workshop + async | Workshop + async | Async |
Outputdifferent | ICE Table, Top Idea List | Assumption map, Test backlog, Risk ranking | Lean Canvas, Core Assumptions, Experiment Backlog | Experiment results, Decision log, Learning summary |
Tagsno overlap | PrioritizationScoringGrowthDecision | AssumptionsRiskExperimentsValidation | StartupLeanAssumptionsBusiness model | ExperimentsGrowthAnalyticsValidation |