View methods side by side.
Choose up to four methods. Add them using the search and share the comparison by copying its link.
| Criterion |  Innovation How Might We | 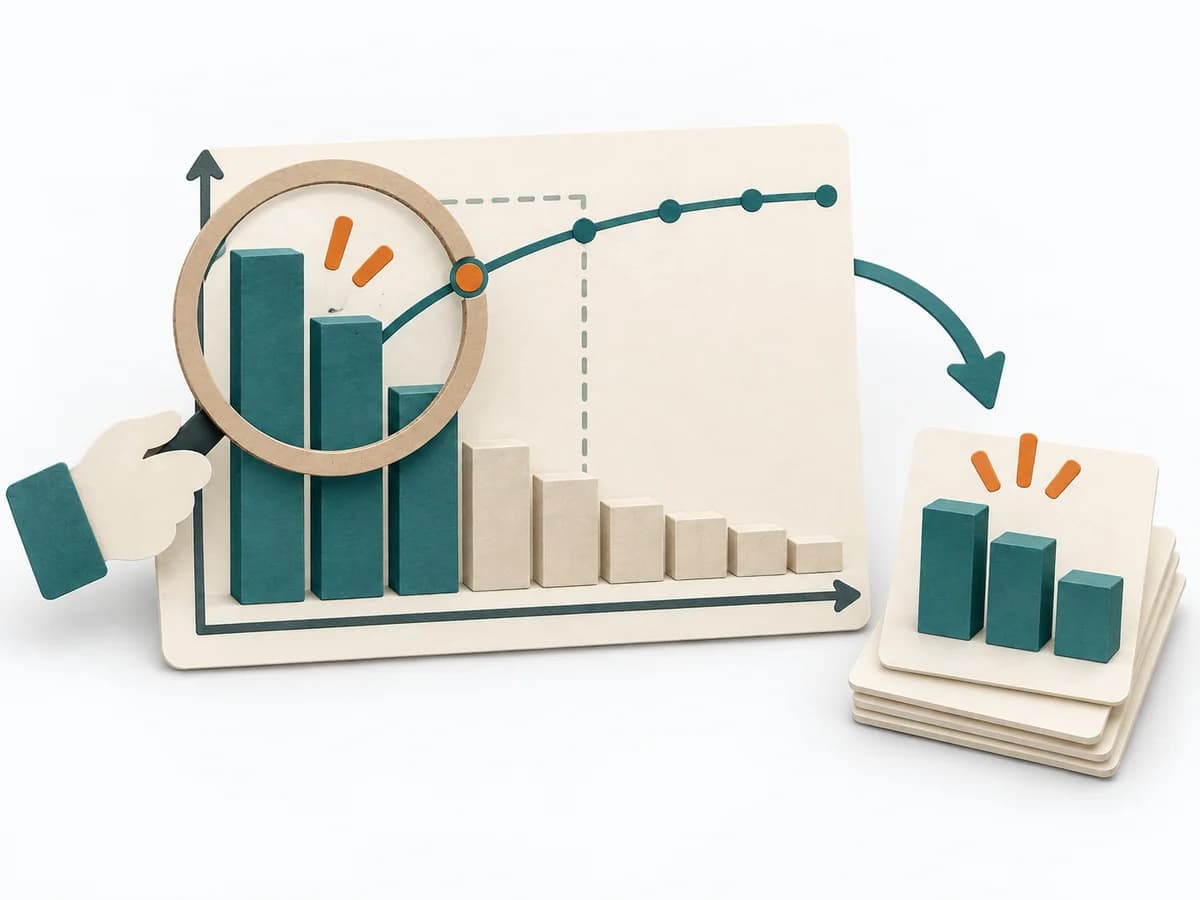 Decision Making Pareto Analysis |  Operations A3 Problem Solving |
|---|---|---|---|
Purposedifferent | With a stuck problem carrying many implicit assumptions, the method translates observations into open, workable questions. It sharpens the problem frame without pre-thinking the solution, turning frustration or fuzziness into a search space with clear direction. | In many problem situations, effect is distributed unequally across many causes. A Pareto Analysis separates the few drivers with high leverage from the long remainder and focuses attention on what measurably moves the needle. | For a complex deviation with several people involved, the method bundles problem, analysis, and decision onto one page. It creates a shared working space where causes, countermeasures, and follow-up fit together. |
Complexitydifferent | Low | Low | Medium |
Timedifferent | 30–45 min | 30-60 min | 45-90 min |
Participantsdifferent | 1-10 | 1-6 | 2-5 |
Formatsame | Workshop + async | Workshop + async | Workshop + async |
Outputdifferent | HMW Questions, Challenge Framing, Idea Prompts | Pareto Chart, Top Causes, Focus List | A3 Report, Action Plan, Root Cause Analysis |
Tagsno overlap | FramingOpportunityIdeationQuestions | PrioritizationQualityFocusRoot cause | LeanProblem solvingCoachingOperations |
Often compared together
Methods with strong topical overlap with the current selection, not yet in the comparison.



