View methods side by side.
Choose up to four methods. Add them using the search and share the comparison by copying its link.
| Criterion |  UX Research HEART Framework | 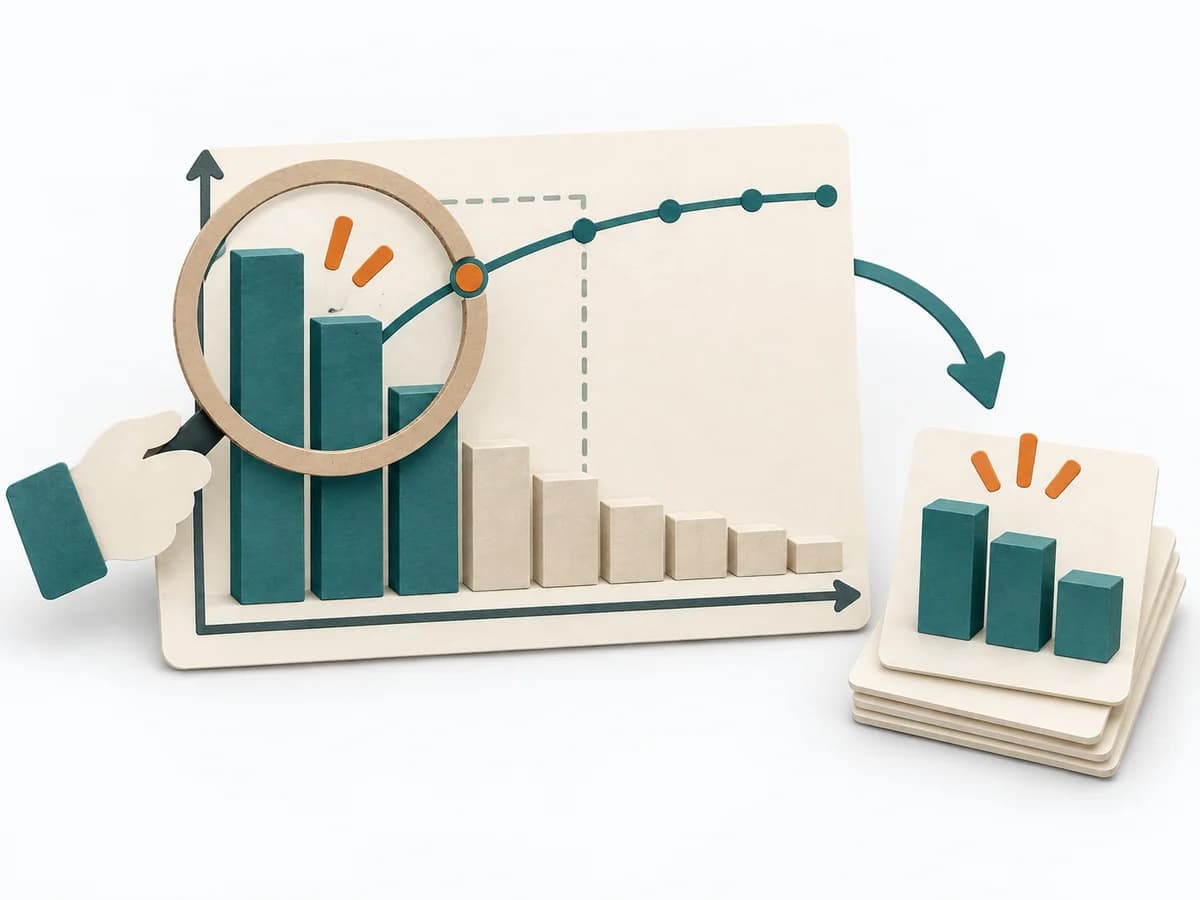 Decision Making Pareto Analysis |  Operations Failure Mode and Effects Analysis |
|---|---|---|---|
Purposedifferent | Helps clarify observations, needs, and patterns in concrete terms. It groups observations into patterns, questions, and decisions. The result is captured as a HEART-GSM table and dashboard. | In many problem situations, effect is distributed unequally across many causes. A Pareto Analysis separates the few drivers with high leverage from the long remainder and focuses attention on what measurably moves the needle. | For a process, product, or service with noticeable failure risks, the method assesses possible failure modes in advance. It directs attention to combinations of occurrence, effect, and detectability. |
Complexitydifferent | Medium | Low | High |
Timedifferent | 120 min initial, dann laufend | 30-60 min | 2-6 h |
Participantsdifferent | 3-6 | 1-6 | 3-10 |
Formatdifferent | Workshop + async | Workshop + async | Workshop |
Outputdifferent | HEART-GSM Table, Dashboard | Pareto Chart, Top Causes, Focus List | FMEA Table, Risk Priority, Mitigation Actions |
Tagsno overlap | MetricsUX researchMeasurementSatisfaction | PrioritizationQualityFocusRoot cause | RiskQualityOperationsRoot cause |
Often compared together
Methods with strong topical overlap with the current selection, not yet in the comparison.



