View methods side by side.
Choose up to four methods. Add them using the search and share the comparison by copying its link.
| Criterion | 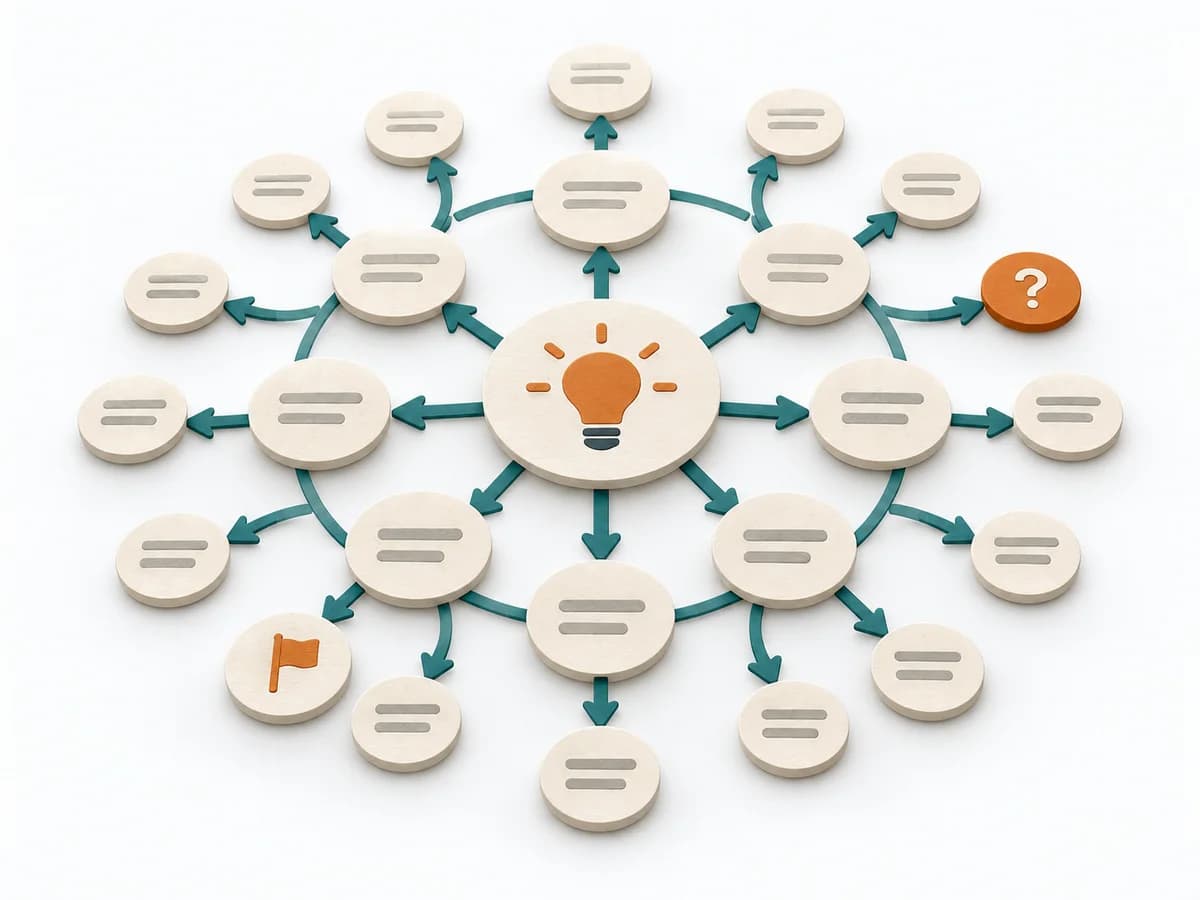 Systems Thinking Futures Wheel |  Agile Example Mapping |  Systems Thinking Behavior Over Time Graph |  Agile Specification by Example |
|---|---|---|---|---|
Purposedifferent | The Futures Wheel helps explore the consequences of a decision, a trend, or a strategic move in a structured way. It makes visible which first, second, and third-order effects could arise from an event. | When a story carries business rules and exceptions, it brings clarity before implementation. It makes examples, open questions, and boundaries visible enough that the logic becomes jointly sound. | A Behavior Over Time Graph shows how a metric or observation develops over time. The method makes trends, breaks, and recurring patterns visible that get lost in snapshots. | When business rules need to become precise, it ties language, example, and test together. It sorts work by value, risk, and delivery ability. The result is captured as an Example Table and Acceptance Tests. |
Complexitydifferent | Medium | Low | Low | Medium |
Timedifferent | 60-120 min | 30-60 min | 20-45 min | 60-90 min pro Feature |
Participantsdifferent | 3-10 | 3-7 | 1-10 | 3-6 |
Formatdifferent | Workshop + async | Workshop | Workshop + async | Workshop |
Outputdifferent | Futures Wheel, Consequence Chains, Strategic Signals | Example Map, Acceptance Criteria, Open Questions | Behavior Over Time Graph, Trend Hypotheses, Key Events | Example Table, Acceptance Tests |
Tagsno overlap | ForesightSystems thinkingSignals | Behavior-Driven DevelopmentRequirementsExamplesRefinement | Systems thinkingPatternsDynamics | AgileRequirementsExamplesBehavior-Driven Development |