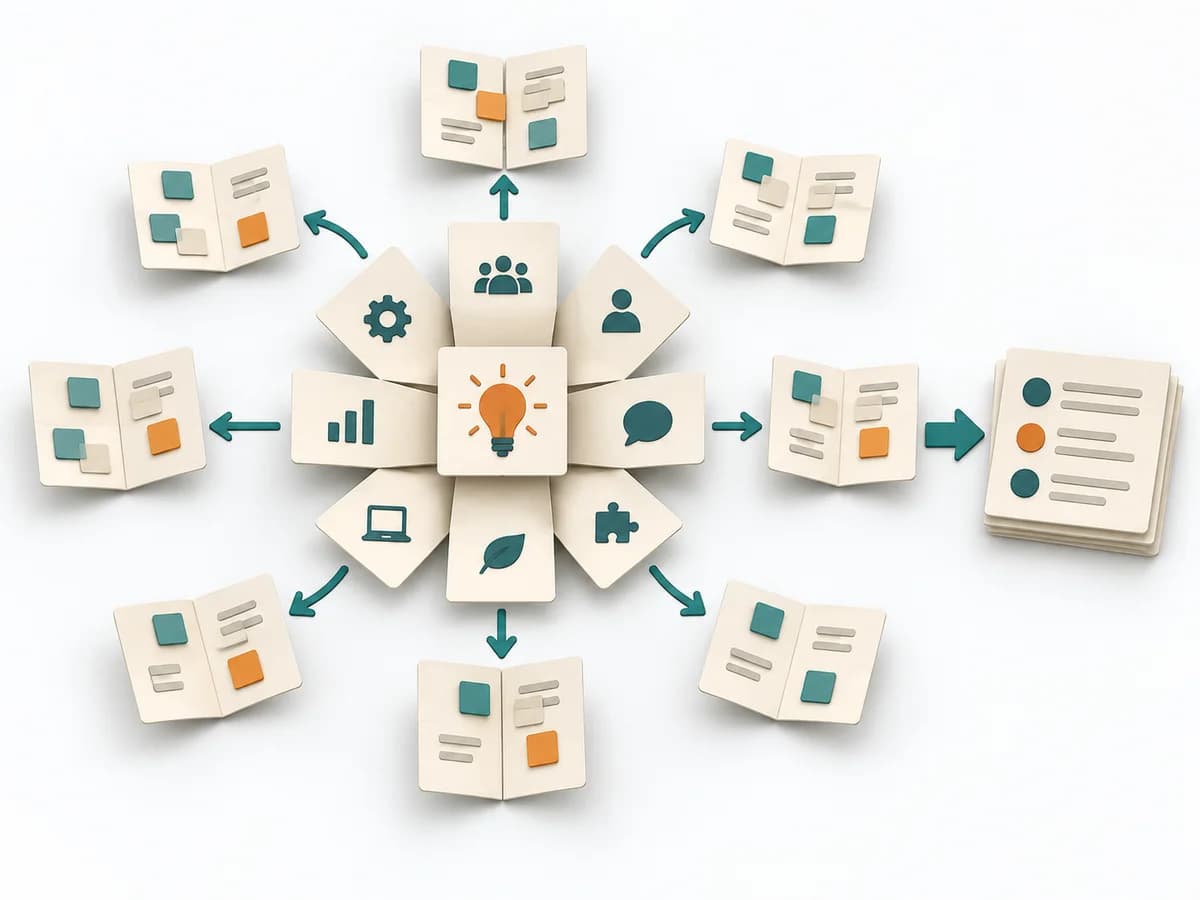
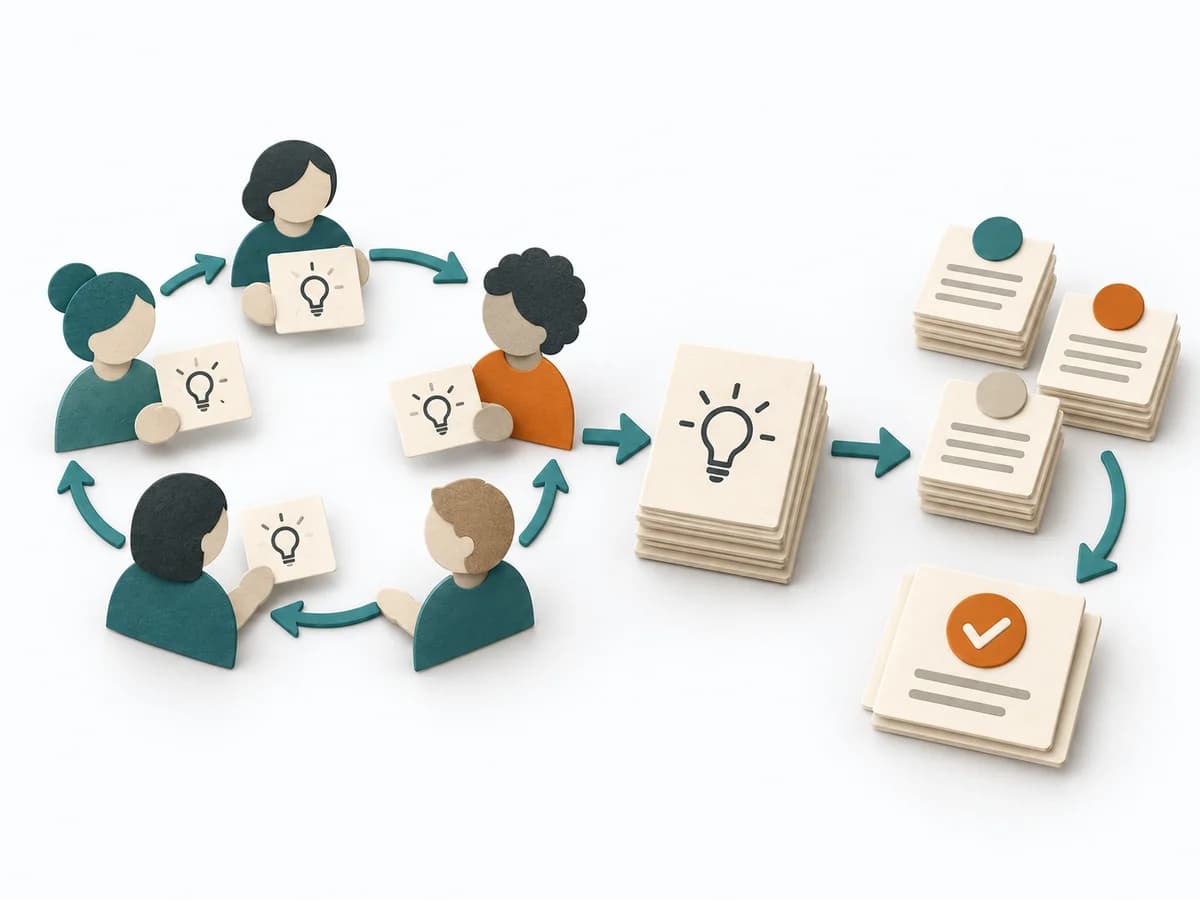
View methods side by side.
Choose up to four methods. Add them using the search and share the comparison by copying its link.
| Criterion |  Operations Failure Mode and Effects Analysis | 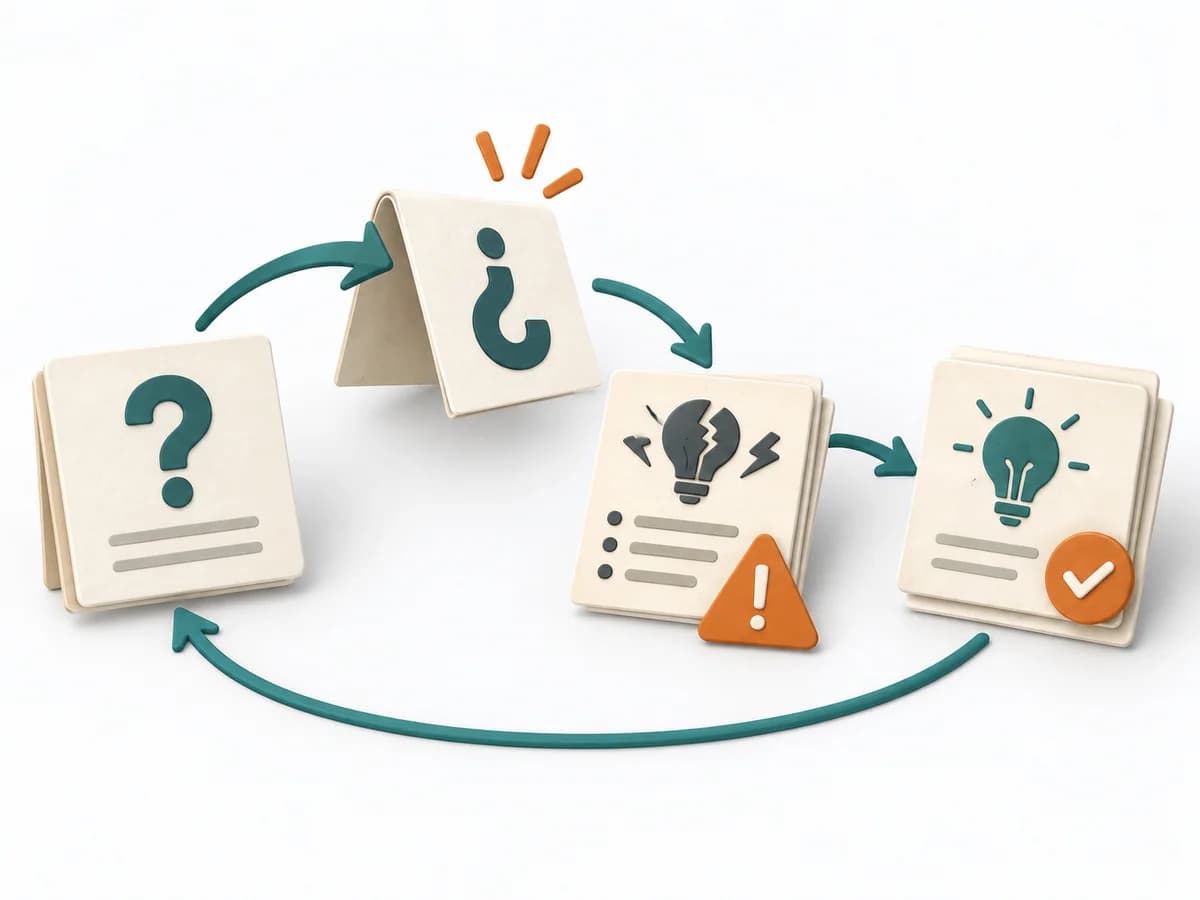 Innovation Reverse Brainstorming |  Operations Fishbone Diagram |
|---|---|---|---|
Purposedifferent | For a process, product, or service with noticeable failure risks, the method assesses possible failure modes in advance. It directs attention to combinations of occurrence, effect, and detectability. | For persistent errors or blockages, the method shifts the view to the opposite of the desired effect. It exposes the mechanics of failure and makes hidden causes easier to grasp. This makes improvement more concrete and the problem clearer. | When a problem has several possible contributing factors, the method sorts causes by cause areas. It prevents an initial hunch from blocking the view of other plausible drivers. |
Complexitydifferent | High | Low | Low |
Timedifferent | 2-6 h | 30-60 min | 30-60 min |
Participantsdifferent | 3-10 | 3-12 | 2-8 |
Formatsame | Workshop | Workshop | Workshop |
Outputdifferent | FMEA Table, Risk Priority, Mitigation Actions | Reverse Ideas, Risk Themes, Solution Ideas | Fishbone Diagram, Cause Categories, Investigation Backlog |
Tagsno overlap | RiskQualityOperationsRoot cause | BrainstormingIdeationCreativityRisk | Root causeQualityOperations |
Often compared together
Methods with strong topical overlap with the current selection, not yet in the comparison.