View methods side by side.
Choose up to four methods. Add them using the search and share the comparison by copying its link.
| Criterion |  Operations Failure Mode and Effects Analysis | 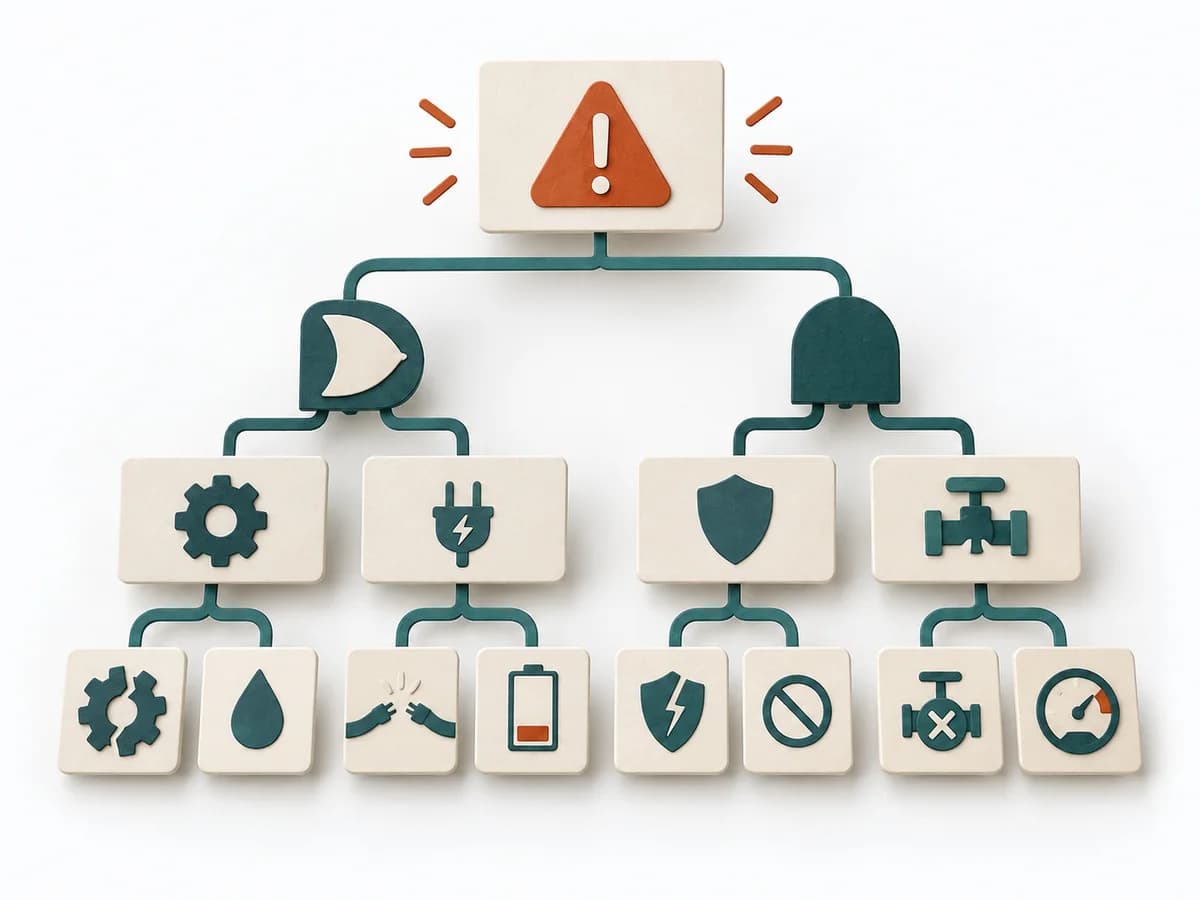 Operations Fault Tree Analysis |  UX Research Affinity Diagramming |
|---|---|---|---|
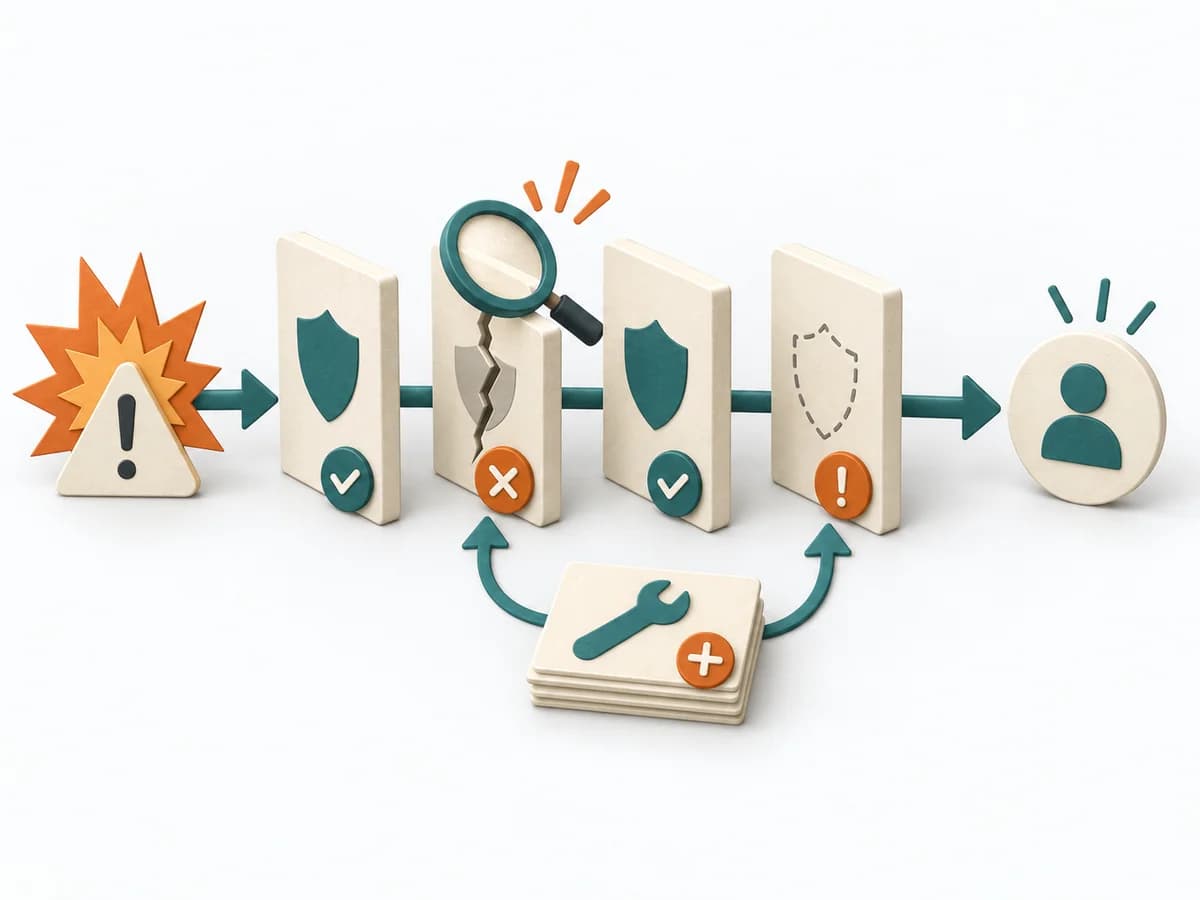
Purposedifferent | For a process, product, or service with noticeable failure risks, the method assesses possible failure modes in advance. It directs attention to combinations of occurrence, effect, and detectability. | For a critical top event with several possible triggers, the method logically models failure paths. It makes visible which combinations of conditions can lead to damage. | When research notes, feedback, or observations sit unconnected side by side, affinity diagramming sorts the raw material into solid themes. Many individual points turn into patterns that make decisions and opportunities clearer. |
Complexitydifferent | High | High | Low |
Timedifferent | 2-6 h | 2-6 h | 45–90 min |
Participantsdifferent | 3-10 | 3-8 | 3-10 |
Formatdifferent | Workshop | Workshop + async | Workshop |
Outputdifferent | FMEA Table, Risk Priority, Mitigation Actions | Fault Tree, Critical Paths, Cause Hypotheses, Control Actions | Theme clusters, Insight statements, Opportunity areas |
Tags1 shared | RiskQualityOperationsRoot cause | RiskRoot causeSafety | SynthesisQualitativeRoot cause |
Often compared together
Methods with strong topical overlap with the current selection, not yet in the comparison.