View methods side by side.
Choose up to four methods. Add them using the search and share the comparison by copying its link.
| Criterion |  Growth Flywheel | 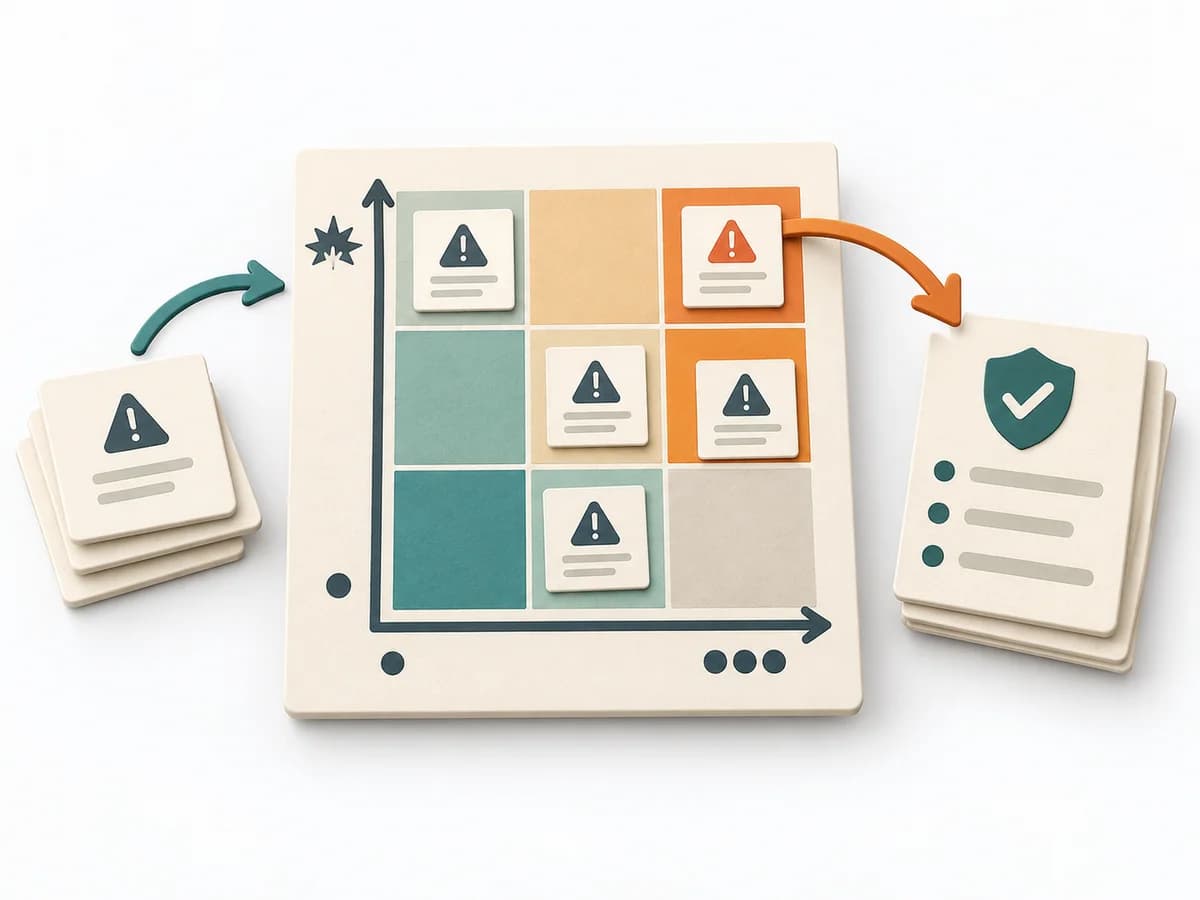 Decision Making Risk Matrix | 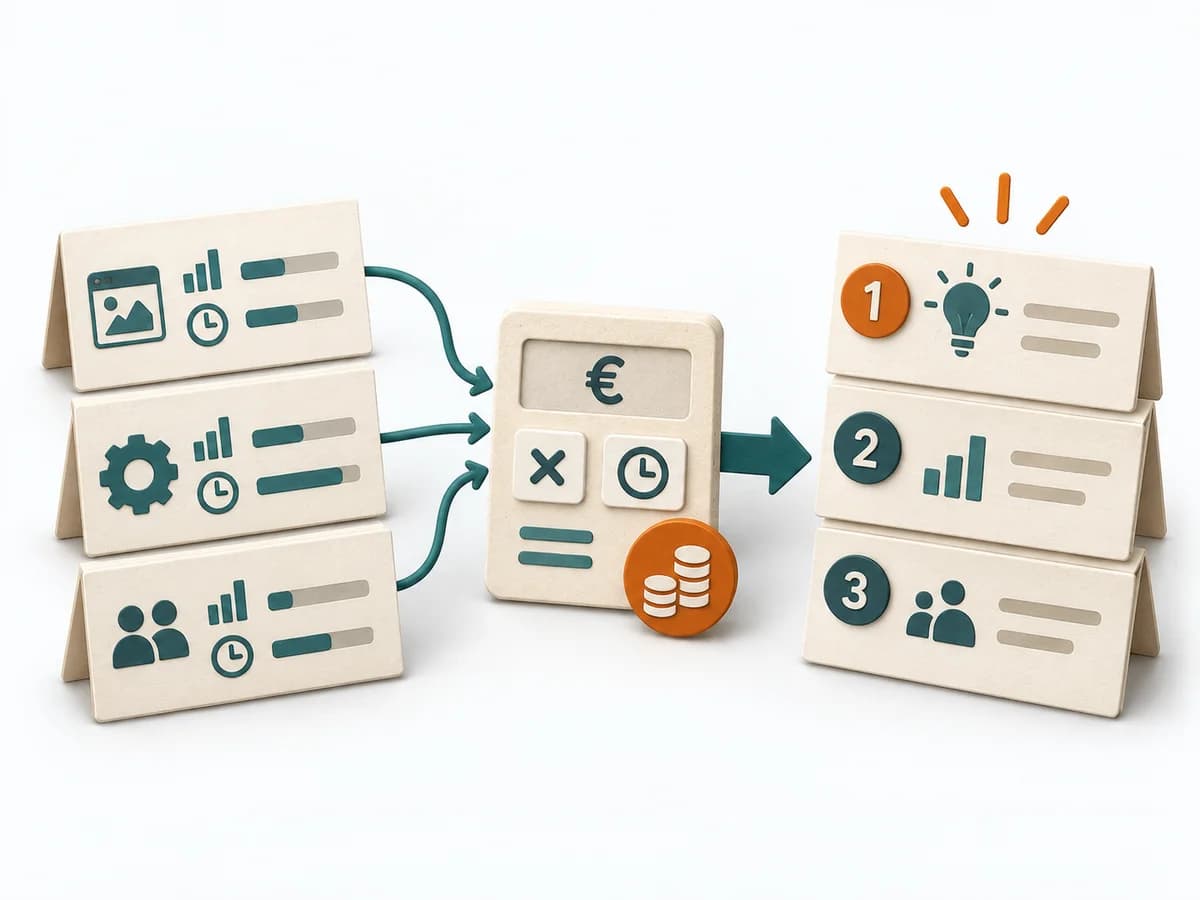 Delivery Cost of Delay | 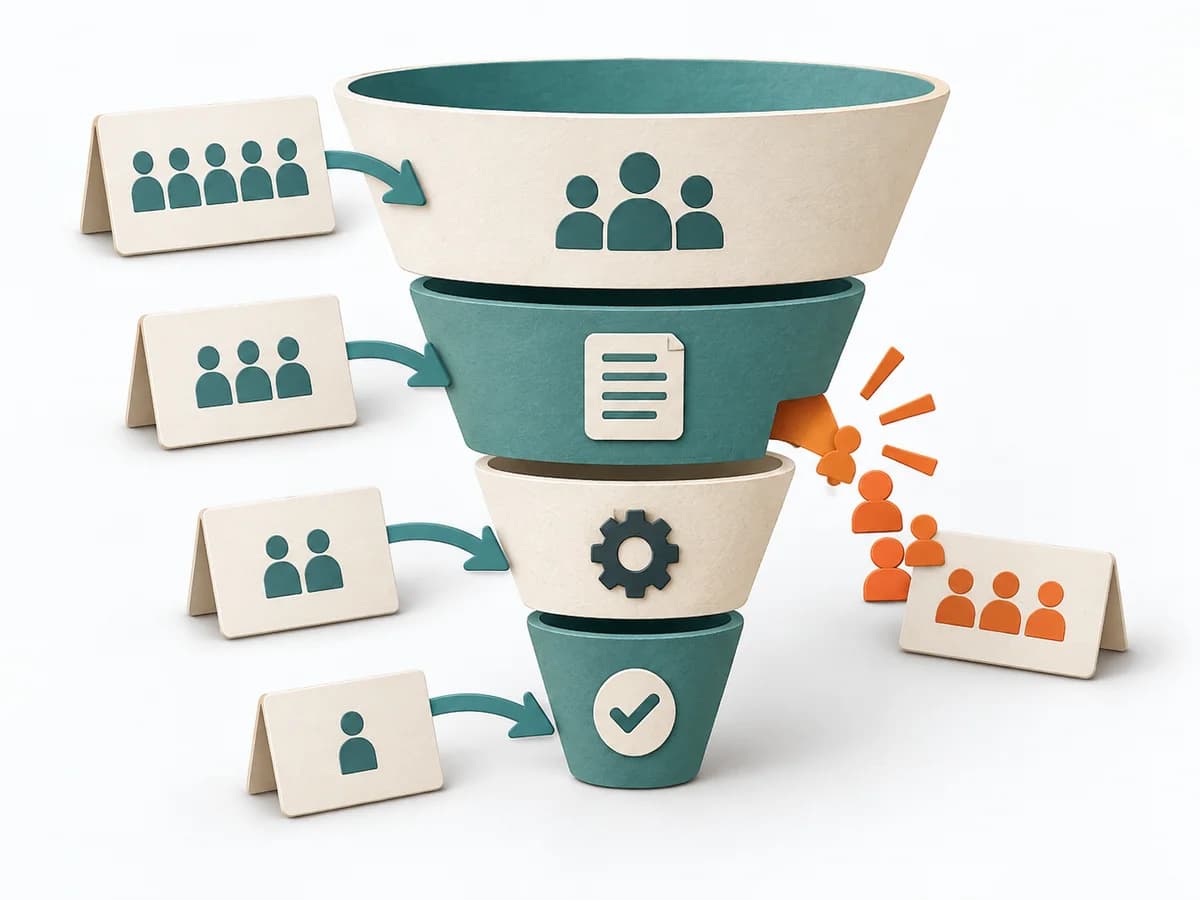 Growth Funnel Analysis |
|---|---|---|---|---|
Purposedifferent | Growth often breaks down where a reinforcing mechanism builds up too much friction. A Flywheel shows the cycle of value, repetition, and reinforcement meant to sustain growth. | When a project faces many possible disruptions, it quickly becomes unclear which risks deserve attention first. It separates options, evaluation criteria, and open risks. The result is captured as a Risk Matrix and a Top Risk List. | Helps clarify scope, order, and delivery flow in concrete terms. It makes work, constraints, and sequence manageable. The result is captured as a Cost of Delay table and prioritization sequence. | When many visitors or users drop off along the way, the reason behind the number often stays hidden. Funnel Analysis exposes these transitions and makes visible exactly where the path collapses. |
Complexitydifferent | Medium | Low | High | Medium |
Timedifferent | 60-120 min | 30-60 min | 90-180 min | 1-3 h |
Participantsdifferent | 3-8 | 3-10 | 3-8 | 1-5 |
Formatdifferent | Workshop | Workshop + async | Workshop | Async |
Outputdifferent | Flywheel Map, Friction Points, Growth Levers, Experiment Backlog | Risk Matrix, Top Risk List | CoD Table, Prioritization Sequence | Funnel report, Drop-off analysis, Optimization hypotheses |
Tagsno overlap | GrowthRetentionConversion | RiskDecisionPrioritizationAssessment | PrioritizationDeliveryEconomicsDecision | AnalyticsConversionGrowth |