View methods side by side.
Choose up to four methods. Add them using the search and share the comparison by copying its link.
| Criterion |  Growth Flywheel |  Business Strategy GAP Analysis | 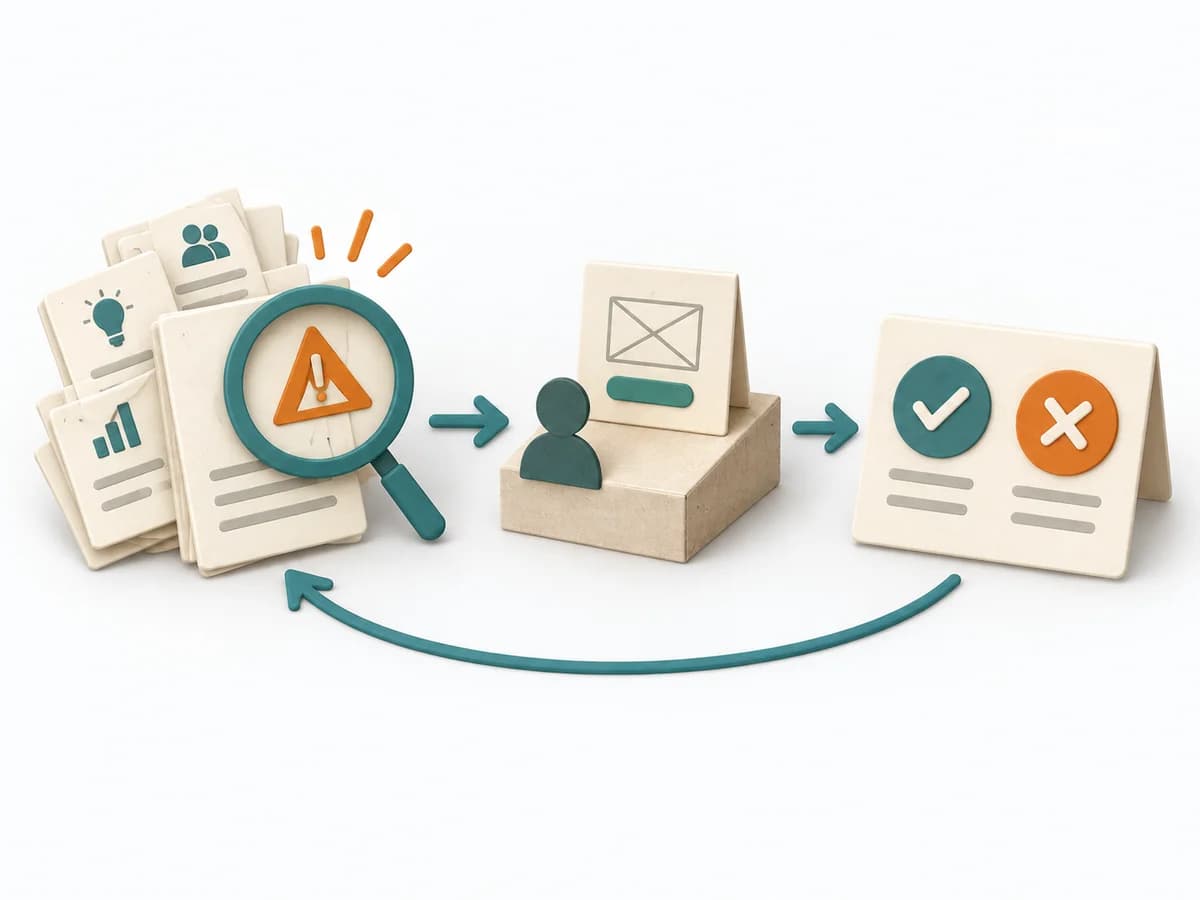 Product Discovery Riskiest Assumption Test |  Product Discovery Assumption Mapping |
|---|---|---|---|---|
Purposedifferent | Growth often breaks down where a reinforcing mechanism builds up too much friction. A Flywheel shows the cycle of value, repetition, and reinforcement meant to sustain growth. | GAP Analysis compares the current state with a target picture and makes the distance manageable. It becomes useful when, ahead of new initiatives, it must become clear which capabilities, processes, or resources are missing. | When an idea hinges on one critical unknown, it prioritizes testing that exact piece of uncertainty first. It separates problem, assumption, solution, and evidence. The result is captured as a prioritized list of assumptions, a test plan, and a result report. | When assumptions still sit unordered in the room, it weighs uncertainty against leverage. It makes visible which hypotheses should be checked first. |
Complexitysame | Medium | Medium | Medium | Medium |
Timedifferent | 60-120 min | 1-3 h | 1-2 Wochen pro Iteration | 45-60 min |
Participantsdifferent | 3-8 | 2-8 | 2-6 | 2-8 |
Formatdifferent | Workshop | Workshop + async | Workshop + async | Workshop + async |
Outputdifferent | Flywheel Map, Friction Points, Growth Levers, Experiment Backlog | Gap Matrix, Action Plan, Risk Notes | Prioritized Assumption List, Test Plan, Results Report | Assumption map, Test backlog, Risk ranking |
Tagsno overlap | GrowthRetentionConversion | StrategyAnalysisPlanning | ExperimentsValidationDiscoveryAssumptions | AssumptionsRiskExperimentsValidation |