View methods side by side.
Choose up to four methods. Add them using the search and share the comparison by copying its link.
| Criterion |  Growth Flywheel | 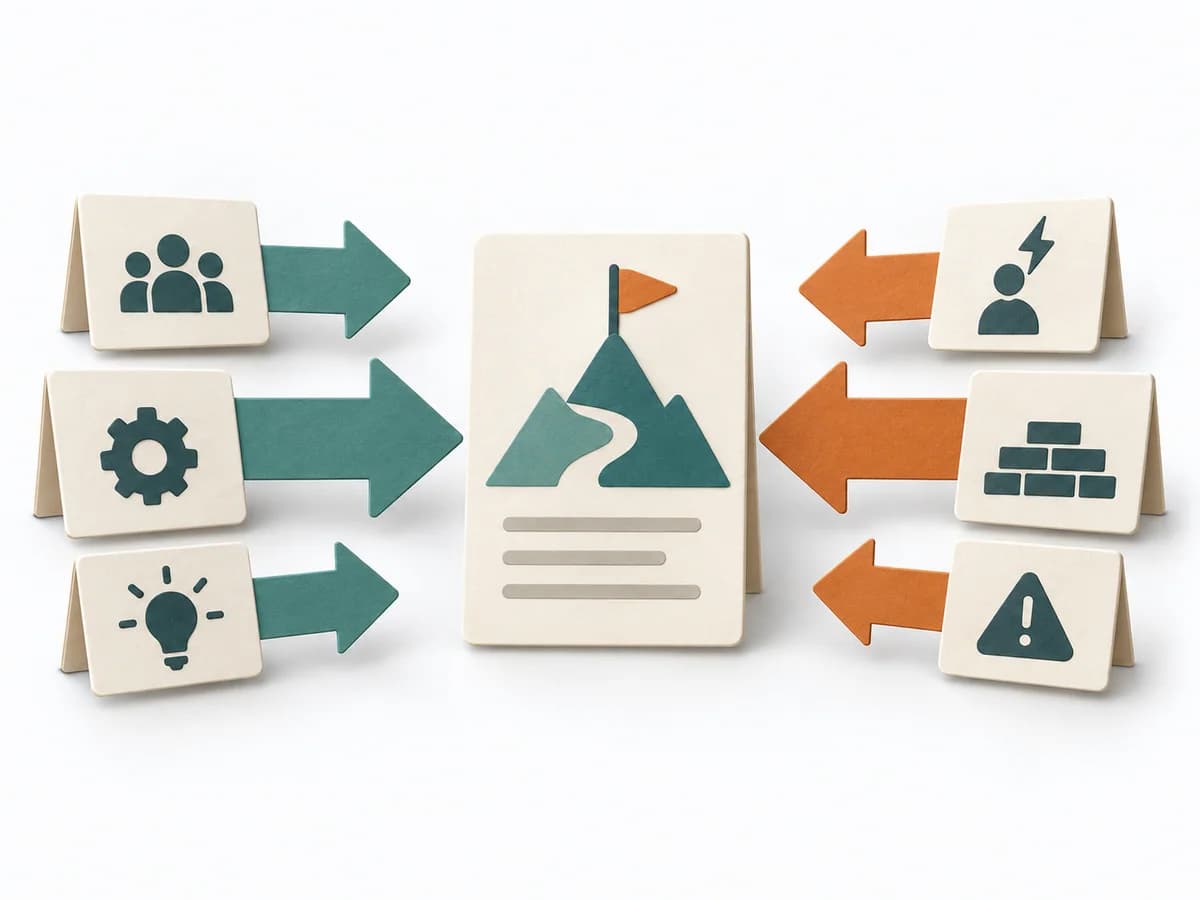 Decision Making Force Field Analysis | 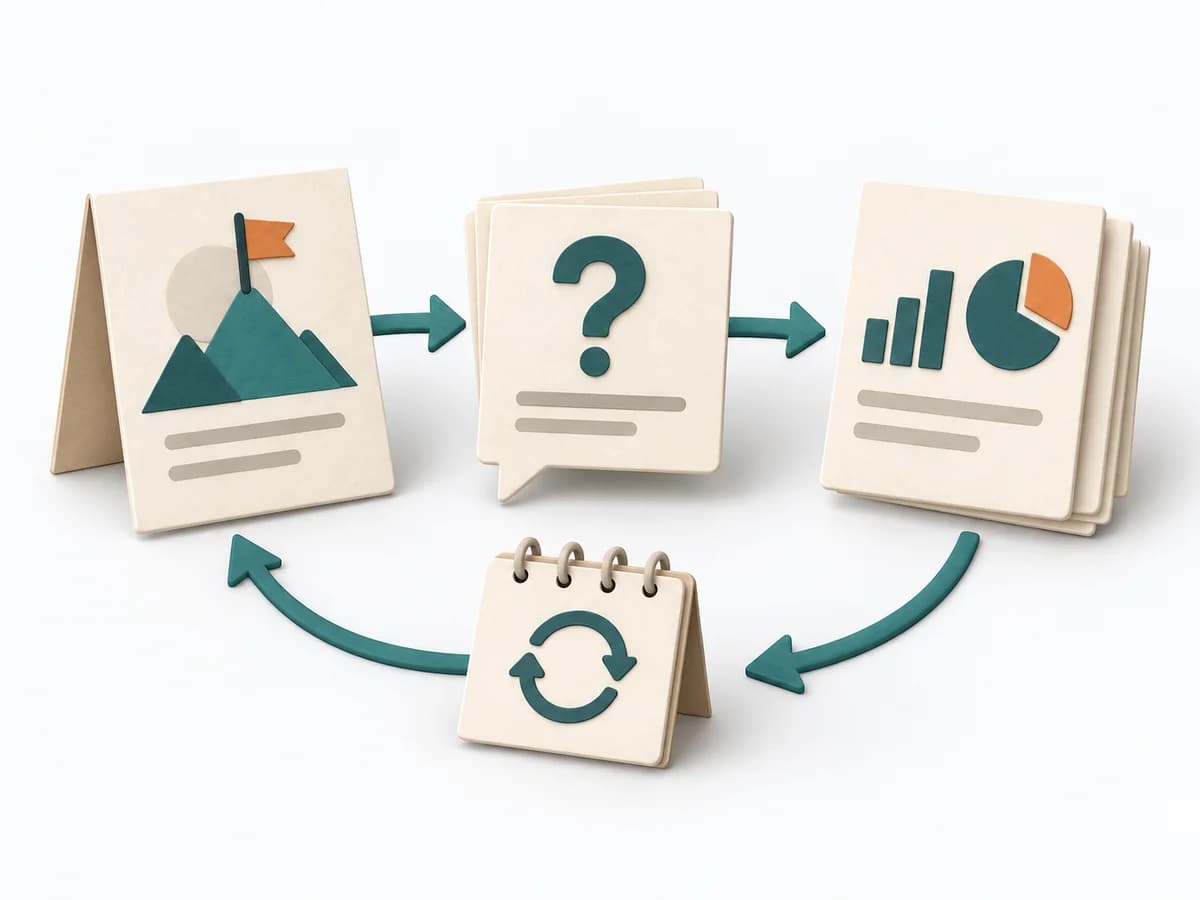 Engineering Goal Question Metric |
|---|---|---|---|
Purposedifferent | Growth often breaks down where a reinforcing mechanism builds up too much friction. A Flywheel shows the cycle of value, repetition, and reinforcement meant to sustain growth. | In change initiatives, supporting and restraining forces sit at the table at the same time. Force Field Analysis makes these tensions explicit and shows where change can be pushed forward by strengthening or relieving. | Helps clarify technical problems, hypotheses, and next steps in concrete terms. It breaks a technical problem into testable parts. The result is captured as a GQM table and metric briefs. |
Complexitydifferent | Medium | Low | Medium |
Timedifferent | 60-120 min | 45-90 min | 90-180 min |
Participantsdifferent | 3-8 | 3-12 | 3-6 |
Formatsame | Workshop | Workshop | Workshop |
Outputdifferent | Flywheel Map, Friction Points, Growth Levers, Experiment Backlog | Force Field Map, Change Levers, Risk Notes | GQM Table, Metric Profiles |
Tagsno overlap | GrowthRetentionConversion | ChangeDecisionStrategy | MetricsMeasurementEngineeringAlignment |
Often compared together
Methods with strong topical overlap with the current selection, not yet in the comparison.