View methods side by side.
Choose up to four methods. Add them using the search and share the comparison by copying its link.
| Criterion |  Knowledge Modeling Feynman Technique | 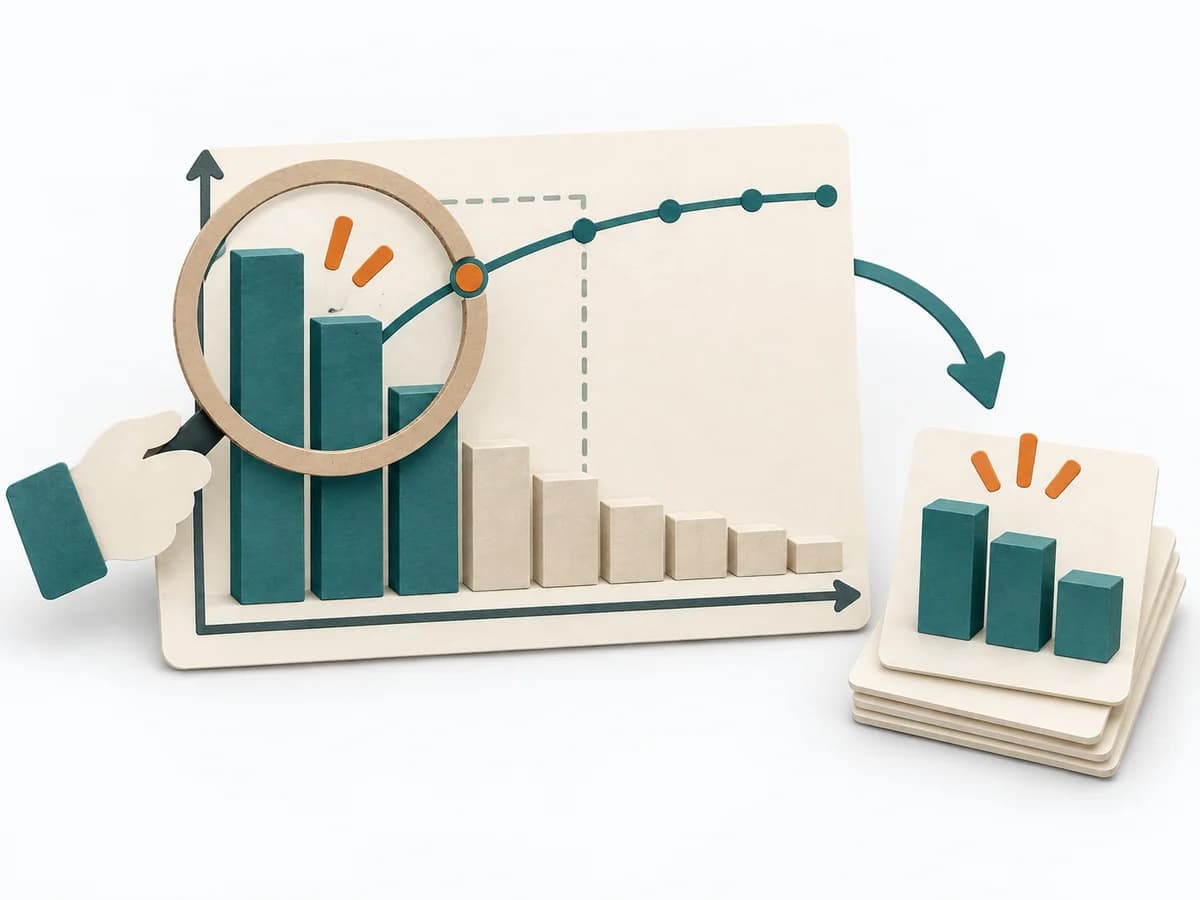 Decision Making Pareto Analysis |  Decision Making Eisenhower Matrix |
|---|---|---|---|
Purposedifferent | The Feynman Technique checks understanding by explaining a topic so that it stays easy for others to understand. It makes knowledge gaps visible before they become costly in everyday work. | In many problem situations, effect is distributed unequally across many causes. A Pareto Analysis separates the few drivers with high leverage from the long remainder and focuses attention on what measurably moves the needle. | It separates true priorities from noise so it becomes clear what should be done now, scheduled, delegated, or dropped. |
Complexitysame | Low | Low | Low |
Timedifferent | 20-60 min | 30-60 min | 15-30 min |
Participantsdifferent | 1 | 1-6 | 1-6 |
Formatdifferent | Async | Workshop + async | Workshop + async |
Outputdifferent | Plain-language Explanation, Knowledge Gaps, Study Notes | Pareto Chart, Top Causes, Focus List | Eisenhower Matrix, Action List, Delegation Notes |
Tagsno overlap | LearningKnowledgeUnderstanding | PrioritizationQualityFocusRoot cause | PrioritizationFocusTasks |
Often compared together
Methods with strong topical overlap with the current selection, not yet in the comparison.