View methods side by side.
Choose up to four methods. Add them using the search and share the comparison by copying its link.
| Criterion | 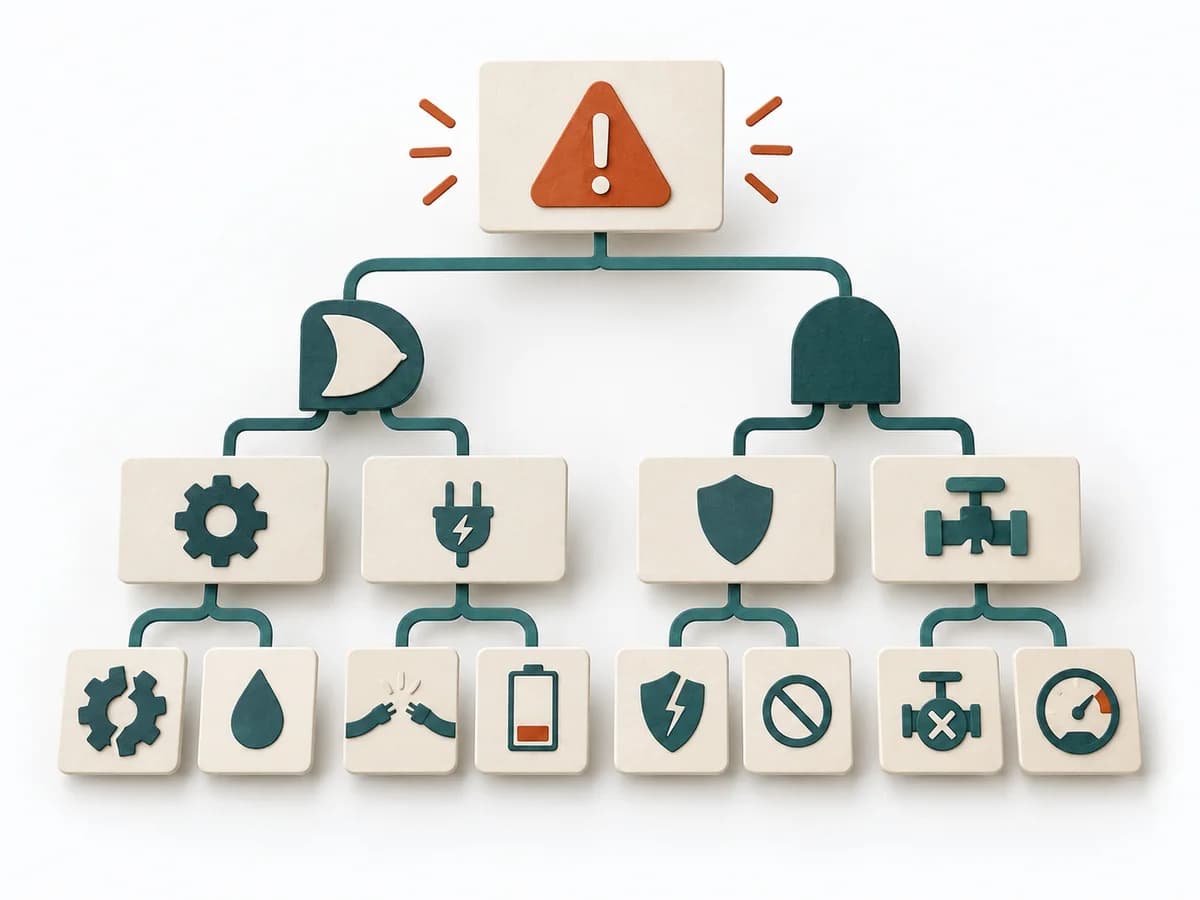 Operations Fault Tree Analysis |  UX Research Surveys |  Growth A/B Testing | 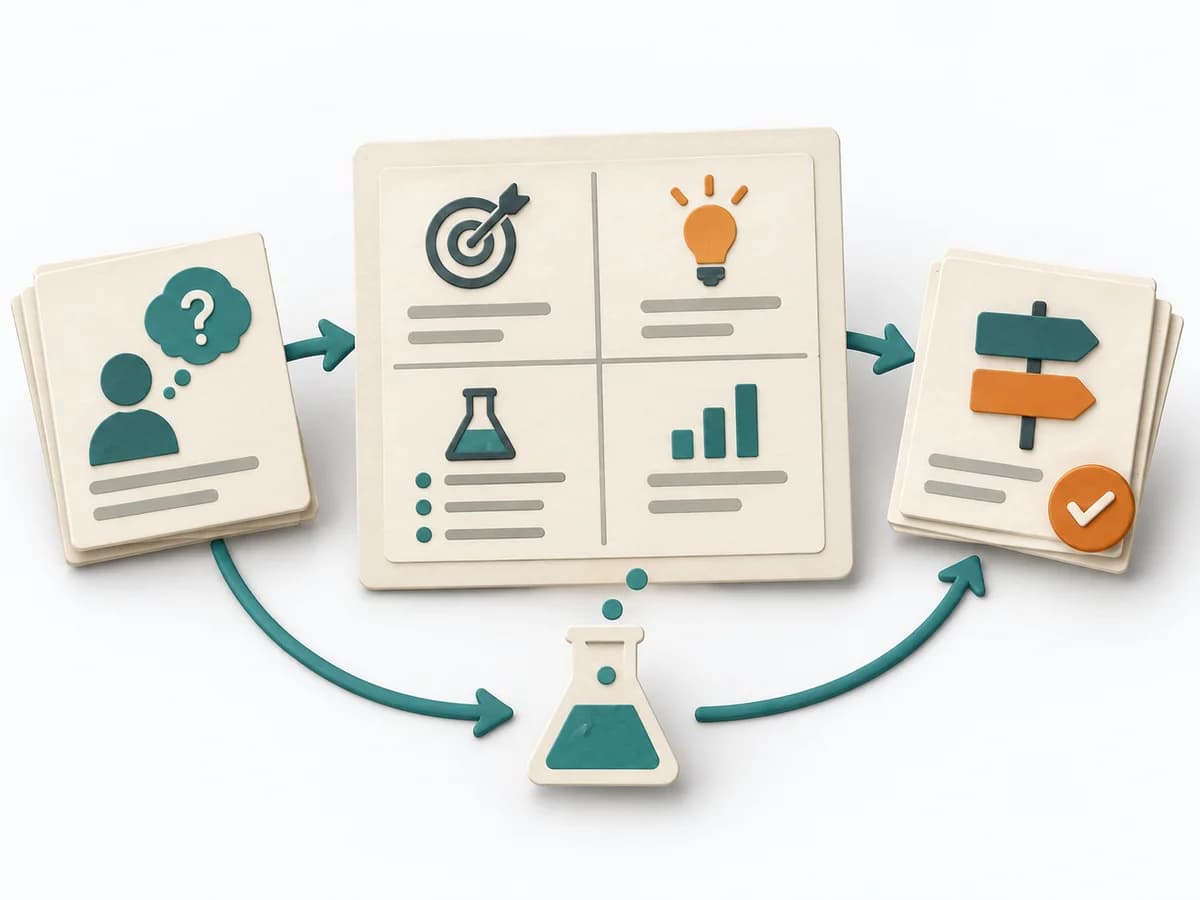 Product Discovery Experiment Canvas |
|---|---|---|---|---|
Purposedifferent | For a critical top event with several possible triggers, the method logically models failure paths. It makes visible which combinations of conditions can lead to damage. | When a topic needs to be validated broadly and many people can answer the same question, surveys gather structured feedback in a scalable form. Answers become comparable and segmentable instead of remaining merely anecdotal. | When two variants compete, discussions quickly decide by taste rather than effect. A/B Testing checks behavior under controlled conditions and separates real improvement from chance or expectation effects. | When experiments become unreadable after the fact, it arranges hypothesis, signal, and learning goal on a single canvas. It separates problem, assumption, solution, and evidence. The result is captured as a Completed Experiment Canvas and a Success Metric. |
Complexitydifferent | High | Medium | High | Low |
Timedifferent | 2-6 h | 3-14 Tage | 1-4 Wochen | 30-60 min |
Participantsdifferent | 3-8 | 50+ | 1-6 | 1-5 |
Formatdifferent | Workshop + async | Async | Async | Workshop + async |
Outputdifferent | Fault Tree, Critical Paths, Cause Hypotheses, Control Actions | Survey Results, Charts, Segment Insights | Experiment results, Decision log, Learning summary | Completed Experiment Canvas, Success Metric |
Tagsno overlap | RiskRoot causeSafety | QuantitativeResearchValidation | ExperimentsGrowthAnalyticsValidation | ExperimentsValidationDiscoveryHypothesis |