View methods side by side.
Choose up to four methods. Add them using the search and share the comparison by copying its link.
| Criterion | 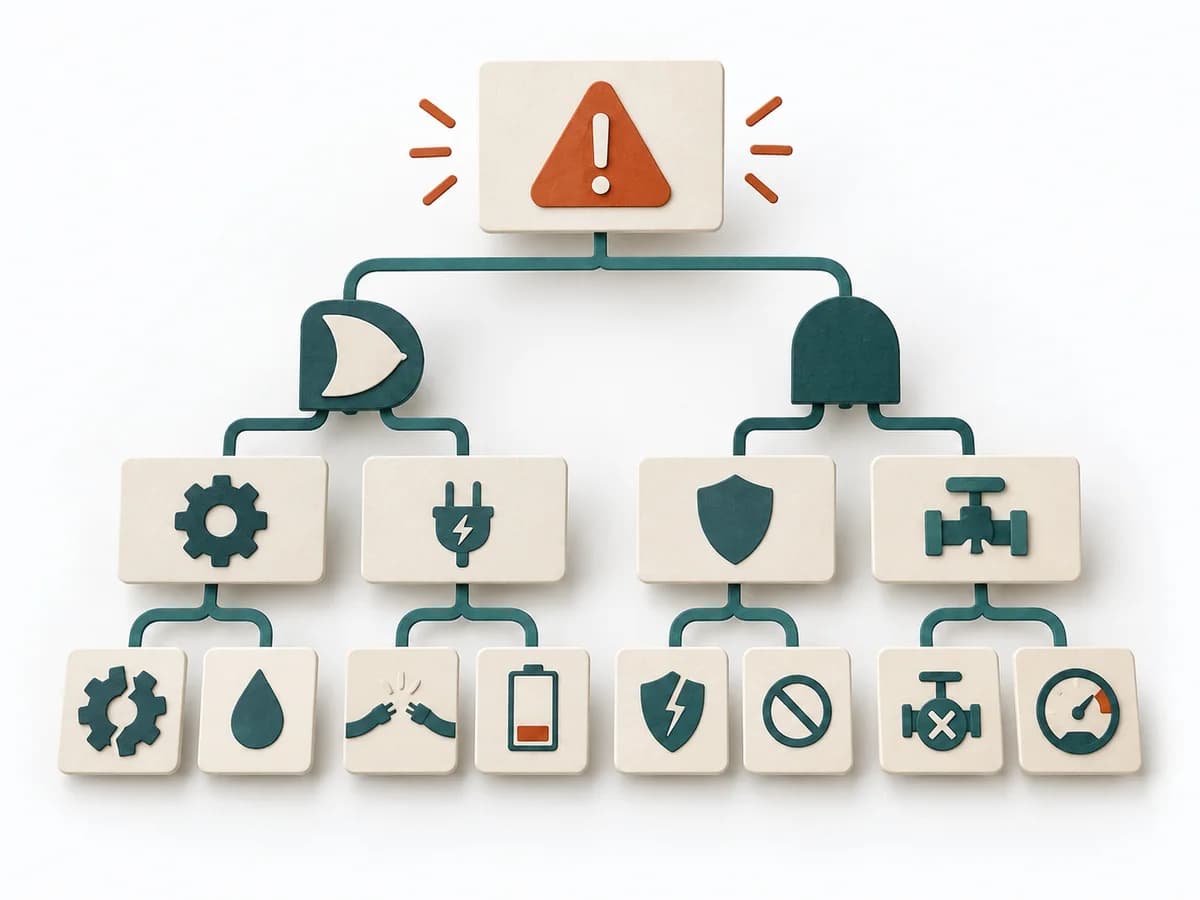 Operations Fault Tree Analysis | 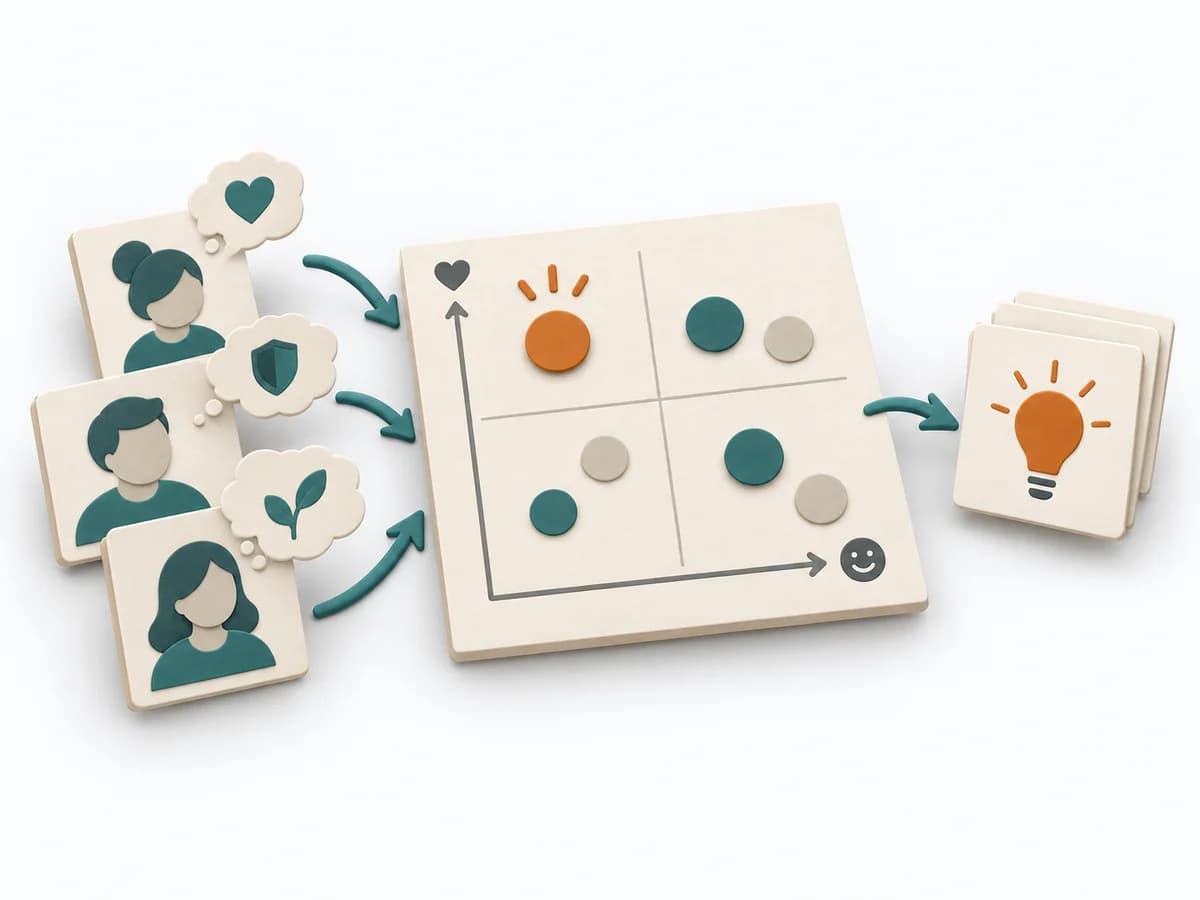 Product Discovery Outcome-Driven Innovation |  Operations Fishbone Diagram |
|---|---|---|---|
Purposedifferent | For a critical top event with several possible triggers, the method logically models failure paths. It makes visible which combinations of conditions can lead to damage. | Outcome-Driven Innovation clarifies customer problems, solution opportunities, and evidence. It separates jobs, desired outcomes, importance, satisfaction, and opportunity, and captures results as desired outcome statements, an opportunity landscape, and segments by underserved needs. | When a problem has several possible contributing factors, the method sorts causes by cause areas. It prevents an initial hunch from blocking the view of other plausible drivers. |
Complexitydifferent | High | High | Low |
Timedifferent | 2-6 h | Mehrere Wochen | 30-60 min |
Participantsdifferent | 3-8 | 2-6 researchers plus sample | 2-8 |
Formatdifferent | Workshop + async | Workshop + async | Workshop |
Outputdifferent | Fault Tree, Critical Paths, Cause Hypotheses, Control Actions | Desired outcome statements, Opportunity landscape, Segmentation by underserved needs, Innovation hypotheses | Fishbone Diagram, Cause Categories, Investigation Backlog |
Tagsno overlap | RiskRoot causeSafety | OutcomesInnovationResearchQuantitative | Root causeQualityOperations |
Often compared together
Methods with strong topical overlap with the current selection, not yet in the comparison.



