View methods side by side.
Choose up to four methods. Add them using the search and share the comparison by copying its link.
| Criterion | 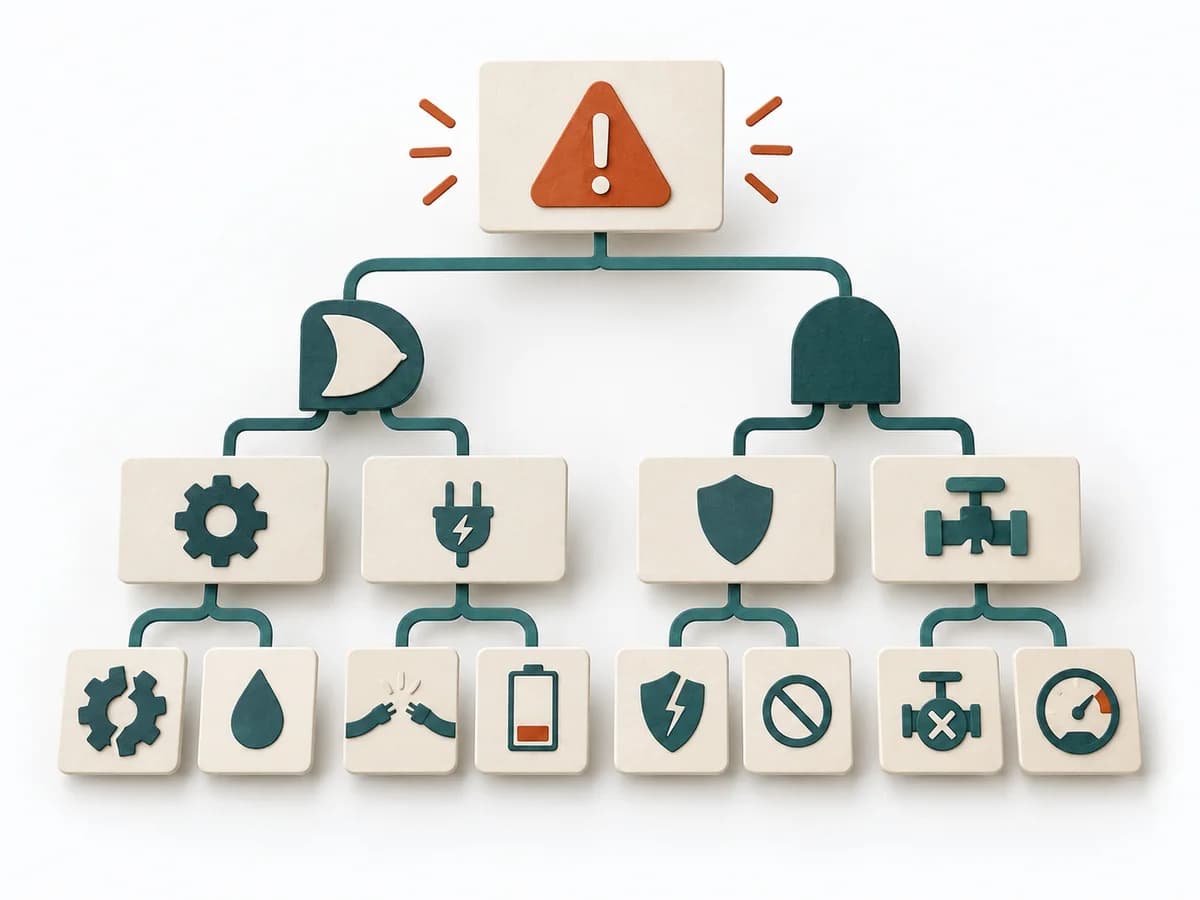 Operations Fault Tree Analysis |  Product Strategy ICE Scoring |  Product Discovery Smoke Test |  Product Discovery Assumption Mapping |
|---|---|---|---|---|
Purposedifferent | For a critical top event with several possible triggers, the method logically models failure paths. It makes visible which combinations of conditions can lead to damage. | When ideas need sorting quickly, it condenses impact, confidence, and effort into one compact score. It connects customer value, product logic, and decision priorities. The result is captured as an ICE table and top-ideas list. | When demand only needs to be roughly verified, it tests interest with minimal effort. It measures whether people would take a next step at all. | When assumptions still sit unordered in the room, it weighs uncertainty against leverage. It makes visible which hypotheses should be checked first. |
Complexitydifferent | High | Low | Low | Medium |
Timedifferent | 2-6 h | 30-60 min | 1-5 Tage | 45-60 min |
Participantsdifferent | 3-8 | 2-8 | Nutzertraffic | 2-8 |
Formatdifferent | Workshop + async | Workshop + async | Async | Workshop + async |
Outputdifferent | Fault Tree, Critical Paths, Cause Hypotheses, Control Actions | ICE Table, Top Idea List | Interest Metrics, Conversion Signal, Learning Note | Assumption map, Test backlog, Risk ranking |
Tagsno overlap | RiskRoot causeSafety | PrioritizationScoringGrowthDecision | ValidationExperimentsDemandGrowth | AssumptionsRiskExperimentsValidation |