View methods side by side.
Choose up to four methods. Add them using the search and share the comparison by copying its link.
| Criterion | 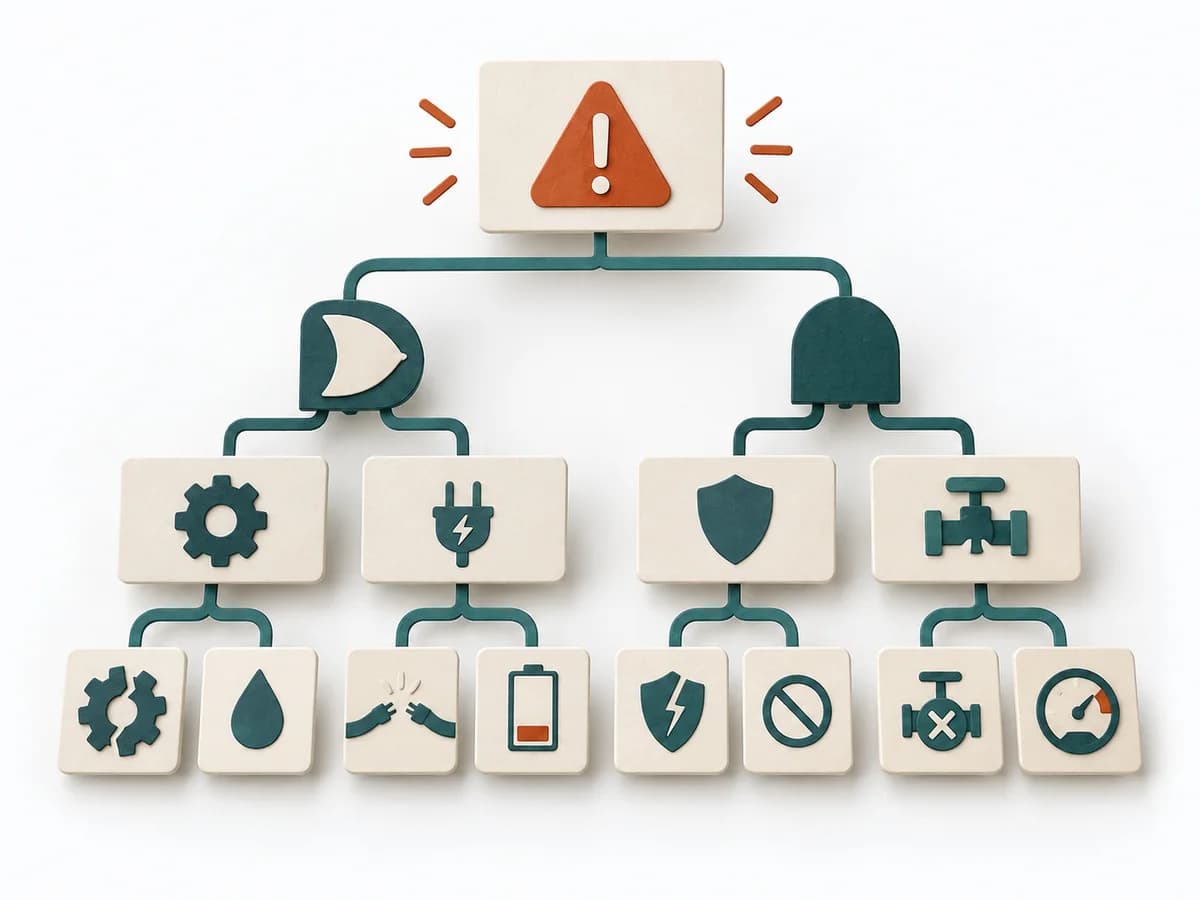 Operations Fault Tree Analysis |  Growth Funnel Analysis | 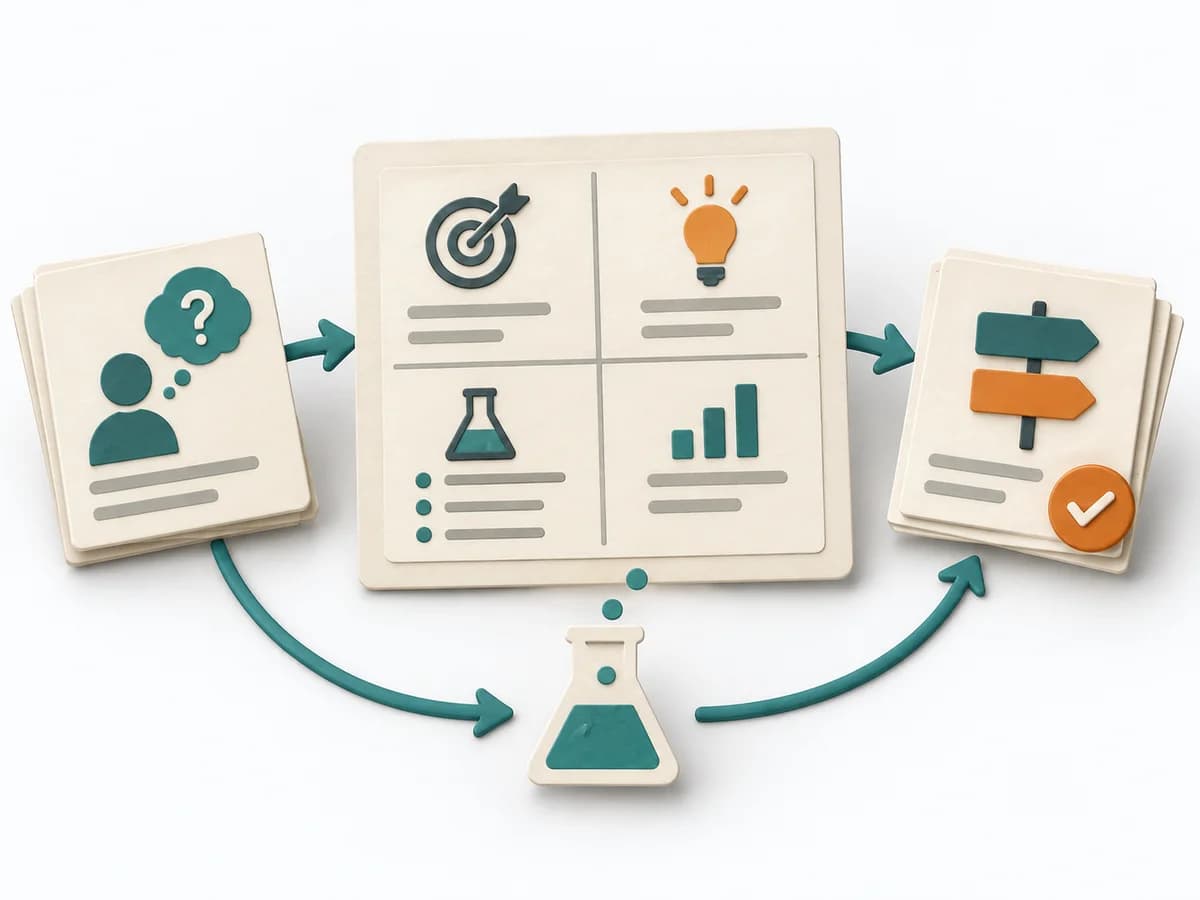 Product Discovery Experiment Canvas |  Product Discovery Assumption Mapping |
|---|---|---|---|---|
Purposedifferent | For a critical top event with several possible triggers, the method logically models failure paths. It makes visible which combinations of conditions can lead to damage. | When many visitors or users drop off along the way, the reason behind the number often stays hidden. Funnel Analysis exposes these transitions and makes visible exactly where the path collapses. | When experiments become unreadable after the fact, it arranges hypothesis, signal, and learning goal on a single canvas. It separates problem, assumption, solution, and evidence. The result is captured as a Completed Experiment Canvas and a Success Metric. | When assumptions still sit unordered in the room, it weighs uncertainty against leverage. It makes visible which hypotheses should be checked first. |
Complexitydifferent | High | Medium | Low | Medium |
Timedifferent | 2-6 h | 1-3 h | 30-60 min | 45-60 min |
Participantsdifferent | 3-8 | 1-5 | 1-5 | 2-8 |
Formatdifferent | Workshop + async | Async | Workshop + async | Workshop + async |
Outputdifferent | Fault Tree, Critical Paths, Cause Hypotheses, Control Actions | Funnel report, Drop-off analysis, Optimization hypotheses | Completed Experiment Canvas, Success Metric | Assumption map, Test backlog, Risk ranking |
Tagsno overlap | RiskRoot causeSafety | AnalyticsConversionGrowth | ExperimentsValidationDiscoveryHypothesis | AssumptionsRiskExperimentsValidation |