View methods side by side.
Choose up to four methods. Add them using the search and share the comparison by copying its link.
| Criterion | 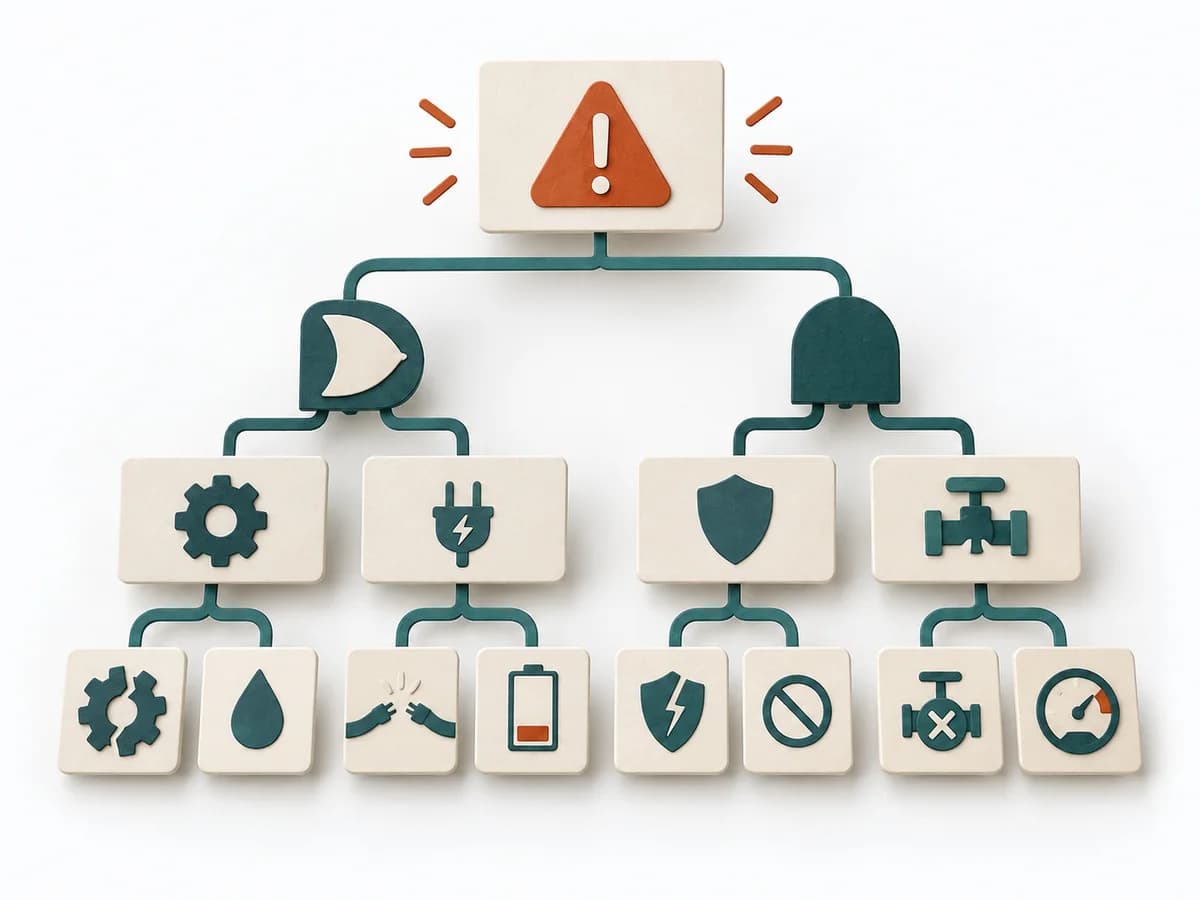 Operations Fault Tree Analysis | 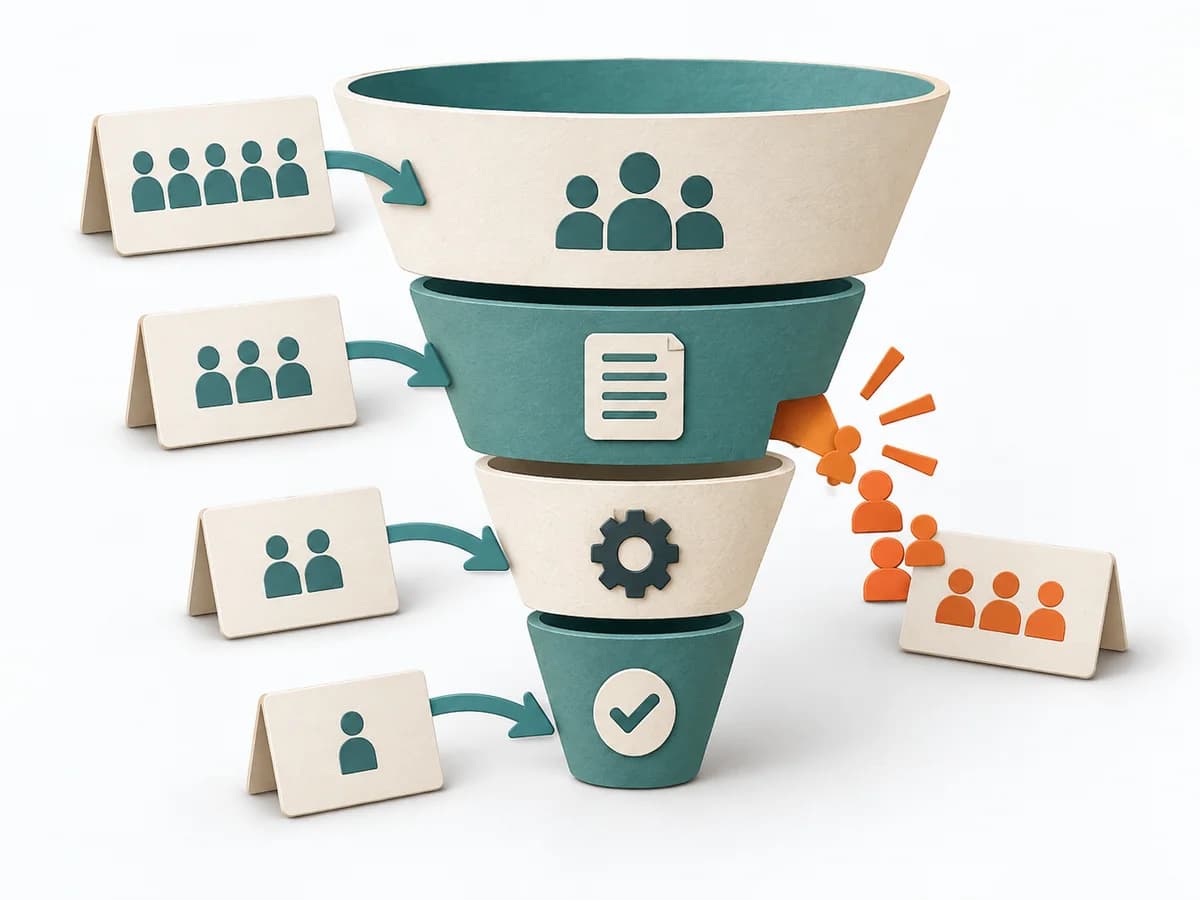 Growth Funnel Analysis | 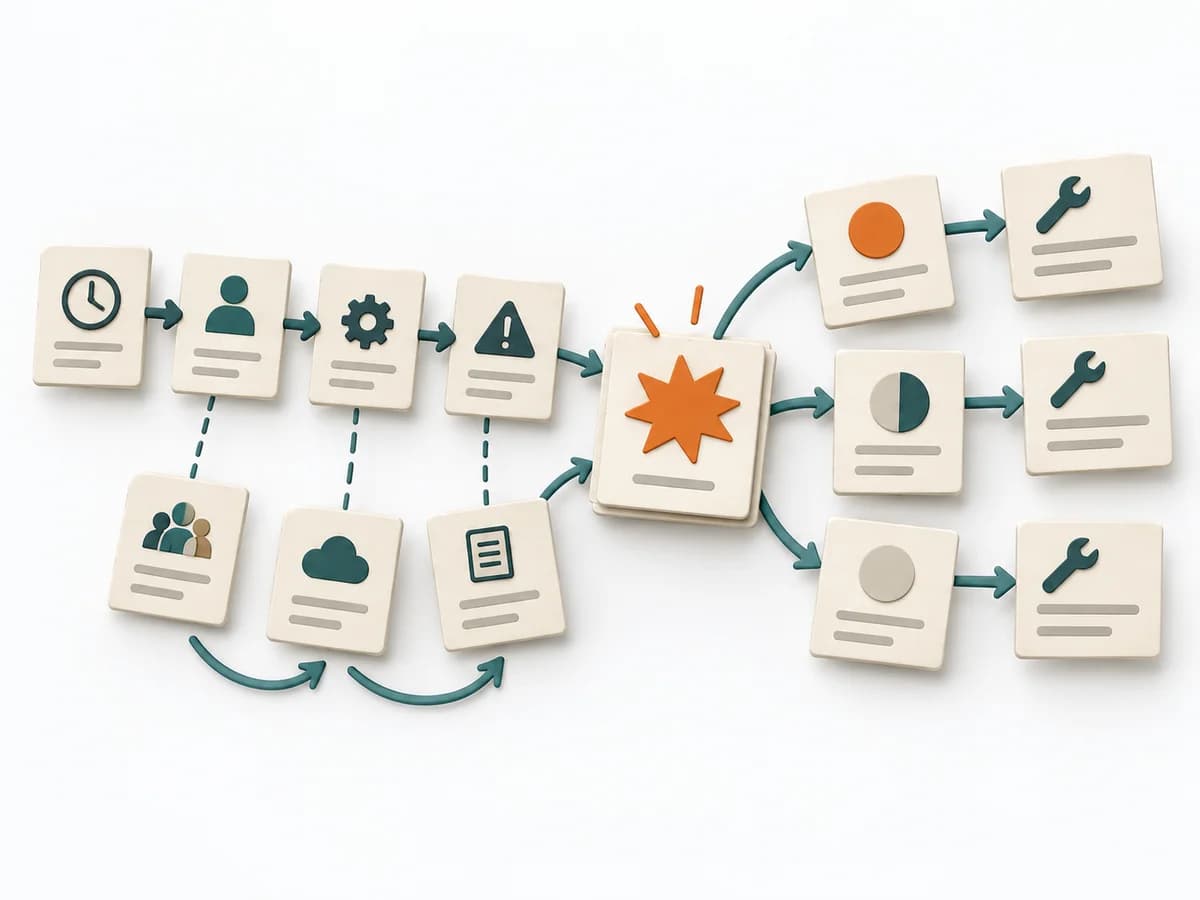 Operations Causal Factor Analysis | 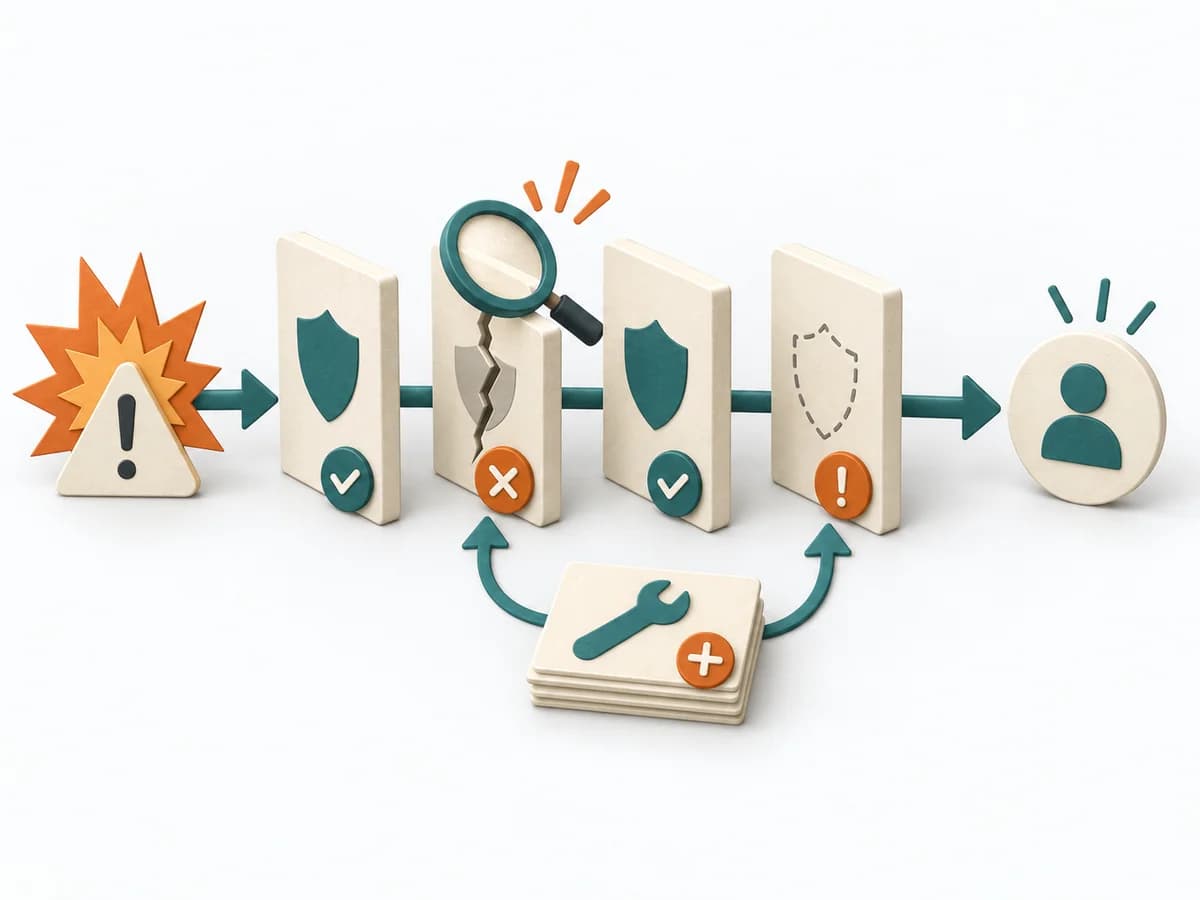 Operations Barrier Analysis |
|---|---|---|---|---|
Purposedifferent | For a critical top event with several possible triggers, the method logically models failure paths. It makes visible which combinations of conditions can lead to damage. | When many visitors or users drop off along the way, the reason behind the number often stays hidden. Funnel Analysis exposes these transitions and makes visible exactly where the path collapses. | For an event with a complicated course, the method breaks down the contributing factors along the timeline. It shows how conditions, decisions, and reactions together produce a course of events. | For a risk that can only be managed through multiple layers of protection, the method examines the effectiveness of each barrier. It shows where safeguards are missing, too weak, or fail under real conditions. |
Complexitydifferent | High | Medium | High | Medium |
Timedifferent | 2-6 h | 1-3 h | 2-6 h | 2-4 h |
Participantsdifferent | 3-8 | 1-5 | 3-10 | 2-6 |
Formatdifferent | Workshop + async | Async | Workshop + async | Workshop + async |
Outputdifferent | Fault Tree, Critical Paths, Cause Hypotheses, Control Actions | Funnel report, Drop-off analysis, Optimization hypotheses | Event Timeline, Causal Factor Chart, Cause List, Corrective Actions | Barrier Inventory, Failure Analysis per Barrier, Action Backlog |
Tagsno overlap | RiskRoot causeSafety | AnalyticsConversionGrowth | CausalityIncidentRoot causeTimeline | Root causeSafetyIncident |