View methods side by side.
Choose up to four methods. Add them using the search and share the comparison by copying its link.
| Criterion | 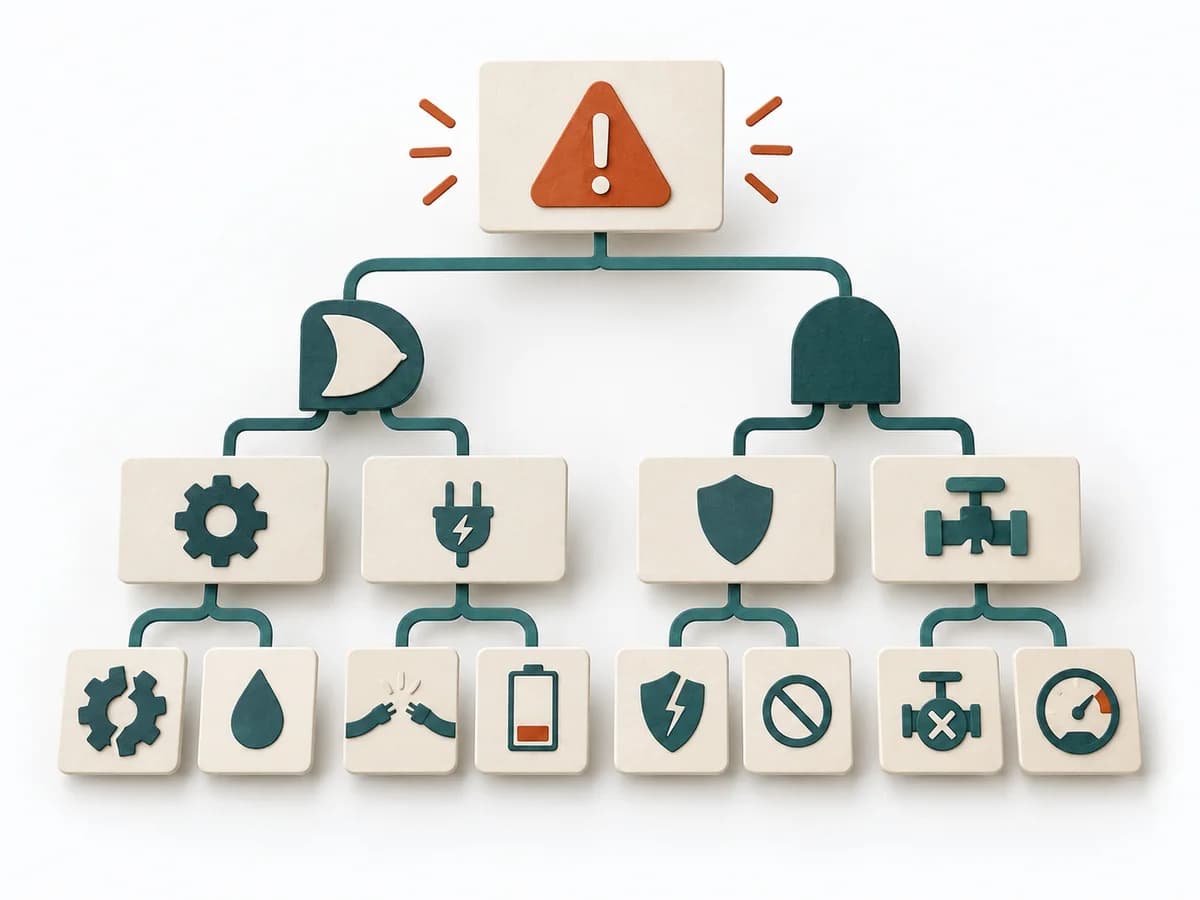 Operations Fault Tree Analysis |  Innovation Design Sprint |  Operations Causal Factor Analysis |  Operations Barrier Analysis |
|---|---|---|---|---|
Purposedifferent | For a critical top event with several possible triggers, the method logically models failure paths. It makes visible which combinations of conditions can lead to damage. | When the product question is unclear and time pressure is high, the method takes a team from an open idea to a testable solution. It connects problem understanding, decision, and learning in one compact format, lowering the risk of spending a lot of energy on a mere guess. | For an event with a complicated course, the method breaks down the contributing factors along the timeline. It shows how conditions, decisions, and reactions together produce a course of events. | For a risk that can only be managed through multiple layers of protection, the method examines the effectiveness of each barrier. It shows where safeguards are missing, too weak, or fail under real conditions. |
Complexitydifferent | High | High | High | Medium |
Timedifferent | 2-6 h | 4-5 Tage | 2-6 h | 2-4 h |
Participantsdifferent | 3-8 | 5-8 | 3-10 | 2-6 |
Formatdifferent | Workshop + async | Workshop | Workshop + async | Workshop + async |
Outputdifferent | Fault Tree, Critical Paths, Cause Hypotheses, Control Actions | Prototype, Test Findings, Decision Rationale | Event Timeline, Causal Factor Chart, Cause List, Corrective Actions | Barrier Inventory, Failure Analysis per Barrier, Action Backlog |
Tagsno overlap | RiskRoot causeSafety | Design sprintPrototypeValidationInnovation | CausalityIncidentRoot causeTimeline | Root causeSafetyIncident |