View methods side by side.
Choose up to four methods. Add them using the search and share the comparison by copying its link.
| Criterion | 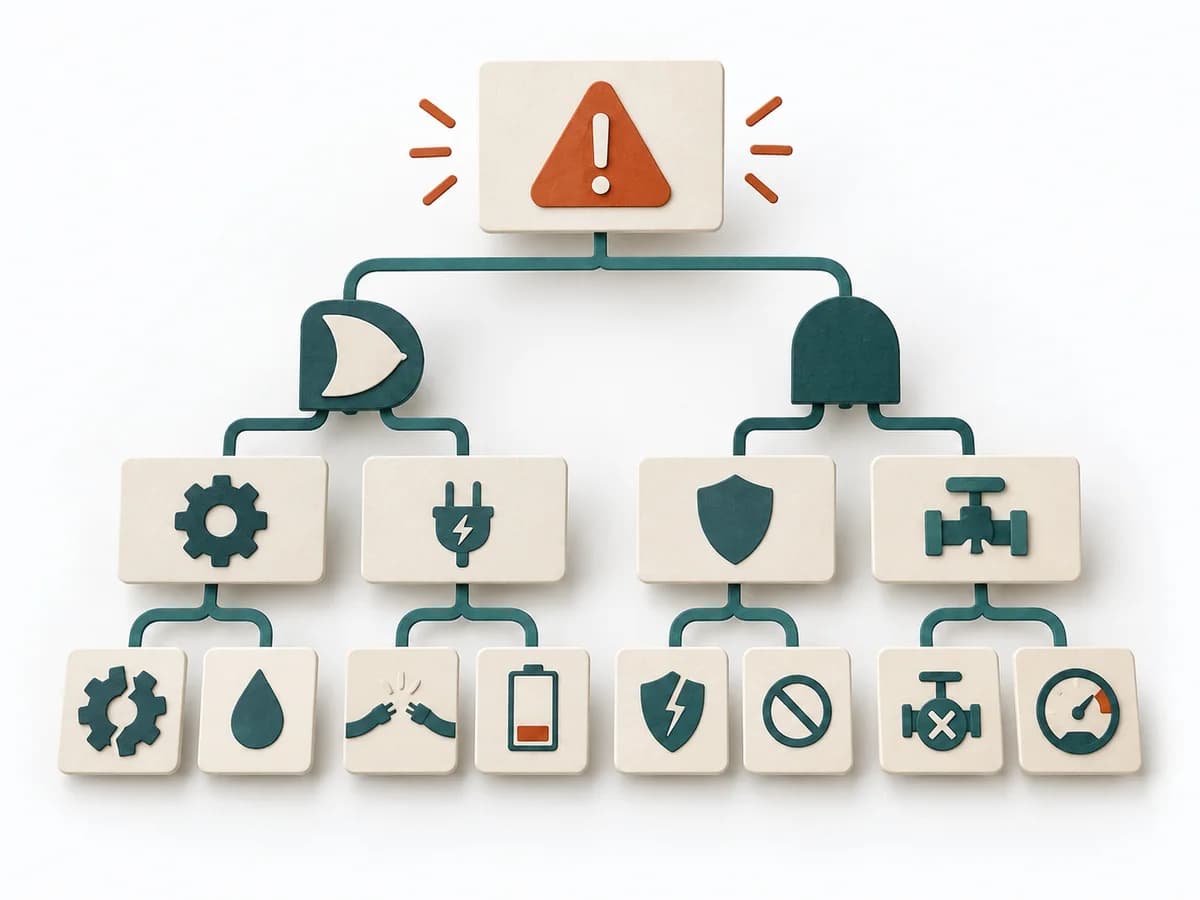 Operations Fault Tree Analysis |  Delivery Cost of Delay | 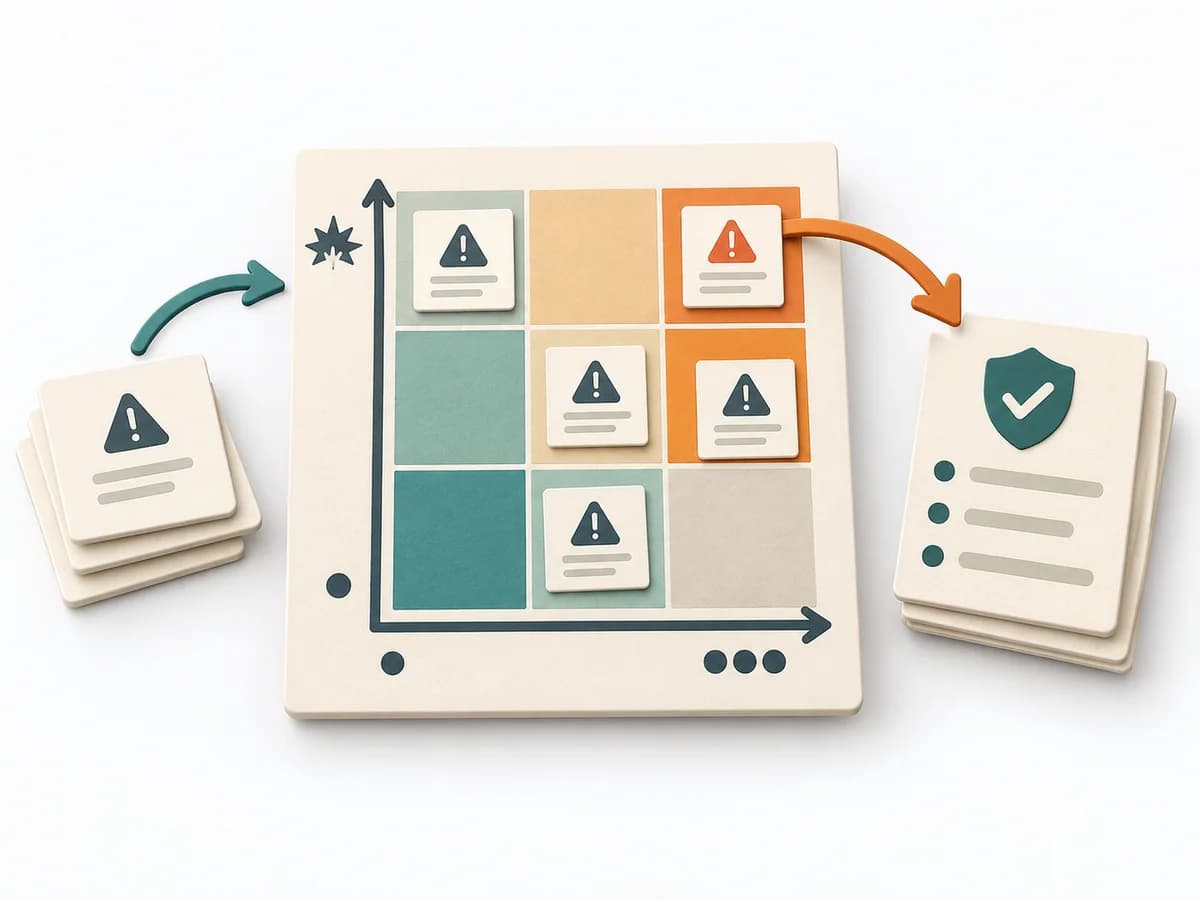 Decision Making Risk Matrix |  Operations Barrier Analysis |
|---|---|---|---|---|
Purposedifferent | For a critical top event with several possible triggers, the method logically models failure paths. It makes visible which combinations of conditions can lead to damage. | Helps clarify scope, order, and delivery flow in concrete terms. It makes work, constraints, and sequence manageable. The result is captured as a Cost of Delay table and prioritization sequence. | When a project faces many possible disruptions, it quickly becomes unclear which risks deserve attention first. It separates options, evaluation criteria, and open risks. The result is captured as a Risk Matrix and a Top Risk List. | For a risk that can only be managed through multiple layers of protection, the method examines the effectiveness of each barrier. It shows where safeguards are missing, too weak, or fail under real conditions. |
Complexitydifferent | High | High | Low | Medium |
Timedifferent | 2-6 h | 90-180 min | 30-60 min | 2-4 h |
Participantsdifferent | 3-8 | 3-8 | 3-10 | 2-6 |
Formatdifferent | Workshop + async | Workshop | Workshop + async | Workshop + async |
Outputdifferent | Fault Tree, Critical Paths, Cause Hypotheses, Control Actions | CoD Table, Prioritization Sequence | Risk Matrix, Top Risk List | Barrier Inventory, Failure Analysis per Barrier, Action Backlog |
Tagsno overlap | RiskRoot causeSafety | PrioritizationDeliveryEconomicsDecision | RiskDecisionPrioritizationAssessment | Root causeSafetyIncident |