View methods side by side.
Choose up to four methods. Add them using the search and share the comparison by copying its link.
| Criterion |  Facilitation Expectation Mapping | 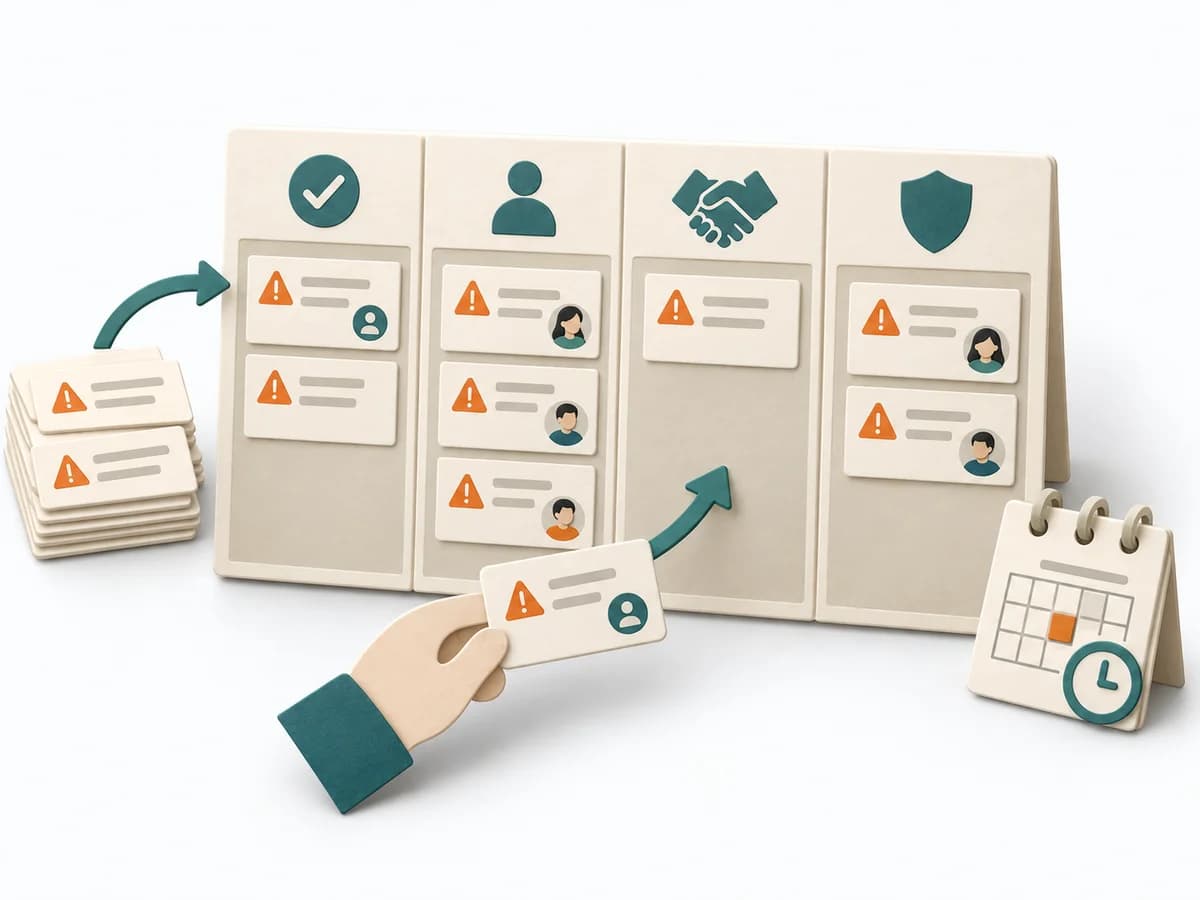 Agile ROAM Board | 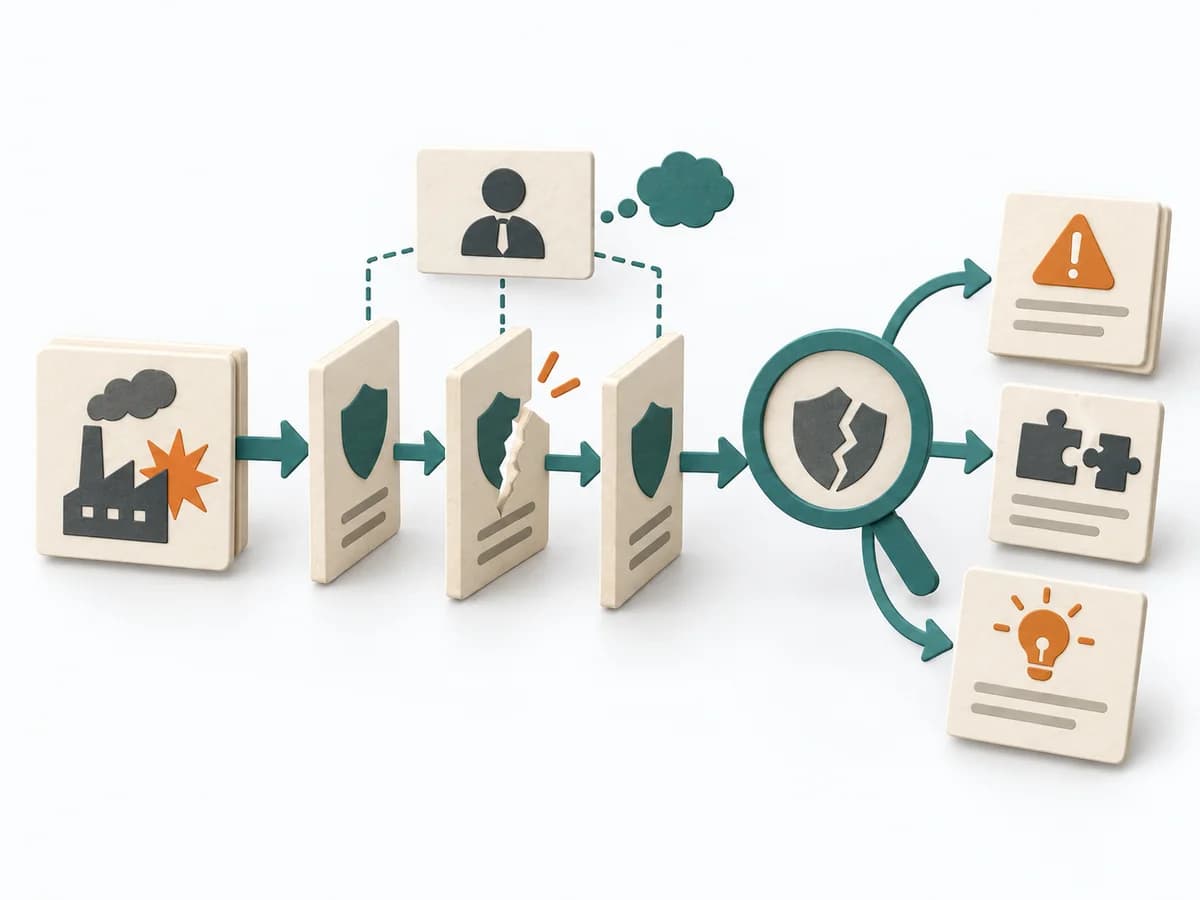 Operations MORT Analysis | 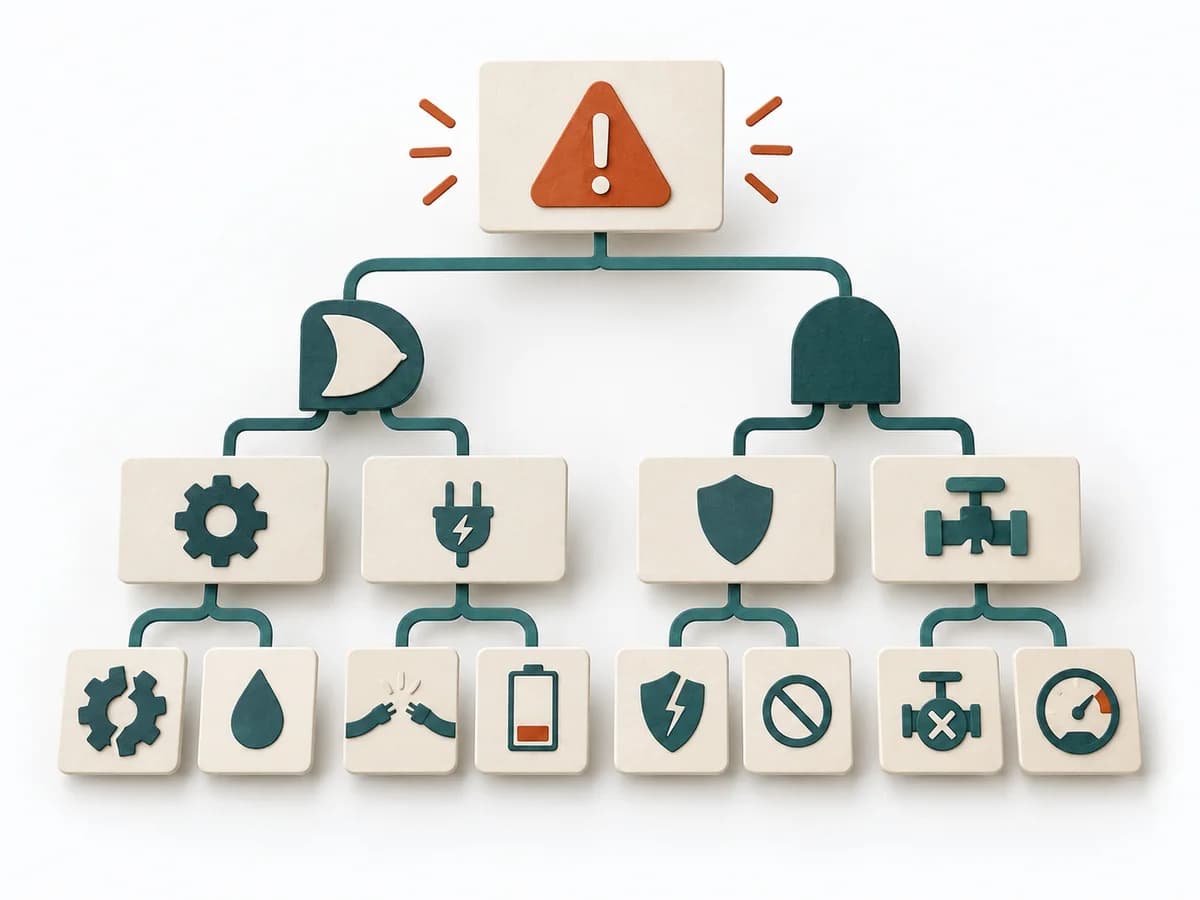 Operations Fault Tree Analysis |
|---|---|---|---|---|
Purposedifferent | When roles, interfaces, or projects fail because of differing expectations, Expectation Mapping surfaces these differences. It shows what each side takes for granted and where the pictures diverge. | When work needs to move between different states or columns, it makes that movement and its handoffs legible. It sorts work by value, risk, and delivery ability. The result is captured as a ROAM Board and an Owner List. | For a safety-relevant event or a system with high protection requirements, the method examines where controls failed. It exposes both technical and organizational gaps. | For a critical top event with several possible triggers, the method logically models failure paths. It makes visible which combinations of conditions can lead to damage. |
Complexitydifferent | Low | Low | High | High |
Timedifferent | 45-90 min | 20-40 min initial, dann laufend | Mehrere Tage bis Wochen | 2-6 h |
Participantsdifferent | 3-12 | 3-15 | 2-6 | 3-8 |
Formatdifferent | Workshop | Workshop + async | Workshop + async | Workshop + async |
Outputdifferent | Expectation Map, Alignment Notes, Agreements | ROAM Board, Owner List | MORT Worksheets, Findings per Branch, Corrective Actions, Systemic Recommendations | Fault Tree, Critical Paths, Cause Hypotheses, Control Actions |
Tagsno overlap | AlignmentStakeholdersTeam | RiskAgileTrackingAlignment | Root causeSafetySystemicIncident | RiskRoot causeSafety |