View methods side by side.
Choose up to four methods. Add them using the search and share the comparison by copying its link.
| Criterion | 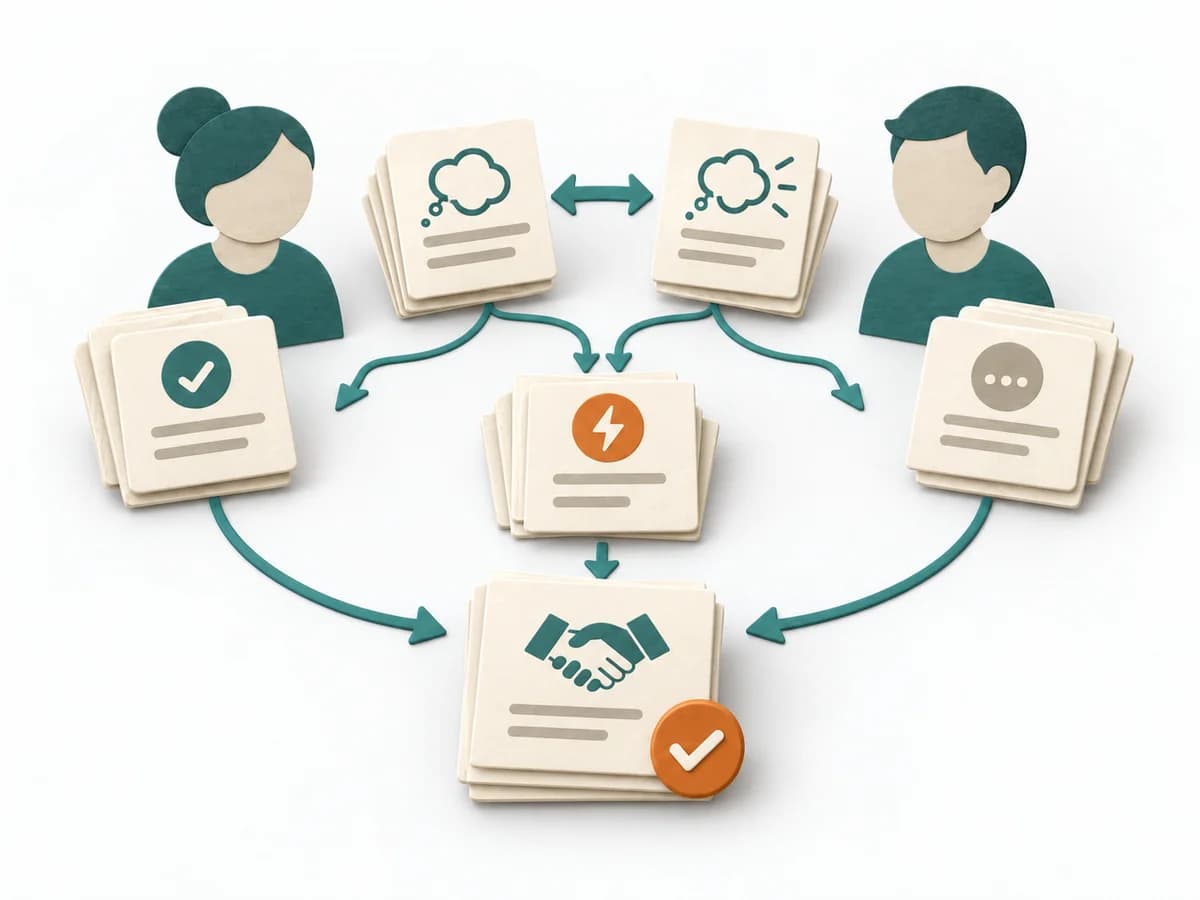 Facilitation Expectation Mapping |  Facilitation Power Interest Grid |  Product Discovery Smoke Test |  Product Discovery Fake Door Test |
|---|---|---|---|---|
Purposedifferent | When roles, interfaces, or projects fail because of differing expectations, Expectation Mapping surfaces these differences. It shows what each side takes for granted and where the pictures diverge. | When many stakeholders compete for attention at once, the Power Interest Grid sorts them by influence and stake. It turns individual contributions into a visible selection. The result is captured as a Power Interest Grid and a stakeholder-specific strategy. | When demand only needs to be roughly verified, it tests interest with minimal effort. It measures whether people would take a next step at all. | When demand is still unclear, it measures interest in a feature before it is built. It separates real behavior from polite agreement and deliberately keeps build effort small. |
Complexitydifferent | Low | Low | Low | Medium |
Timedifferent | 45-90 min | 30-60 min | 1-5 Tage | 1-5 Tage |
Participantsdifferent | 3-12 | 2-8 | Nutzertraffic | Nutzertraffic |
Formatdifferent | Workshop | Workshop | Async | Async |
Outputdifferent | Expectation Map, Alignment Notes, Agreements | Power Interest Grid, Strategy per Stakeholder | Interest Metrics, Conversion Signal, Learning Note | Click Data, Interest Signal, Learning Decision |
Tagsno overlap | AlignmentStakeholdersTeam | StakeholdersFacilitationAlignmentPlanning | ValidationExperimentsDemandGrowth | ValidationExperimentsDemandDiscovery |