View methods side by side.
Choose up to four methods. Add them using the search and share the comparison by copying its link.
| Criterion |  Facilitation Expectation Mapping |  Product Strategy ICE Scoring |  Product Discovery Smoke Test | 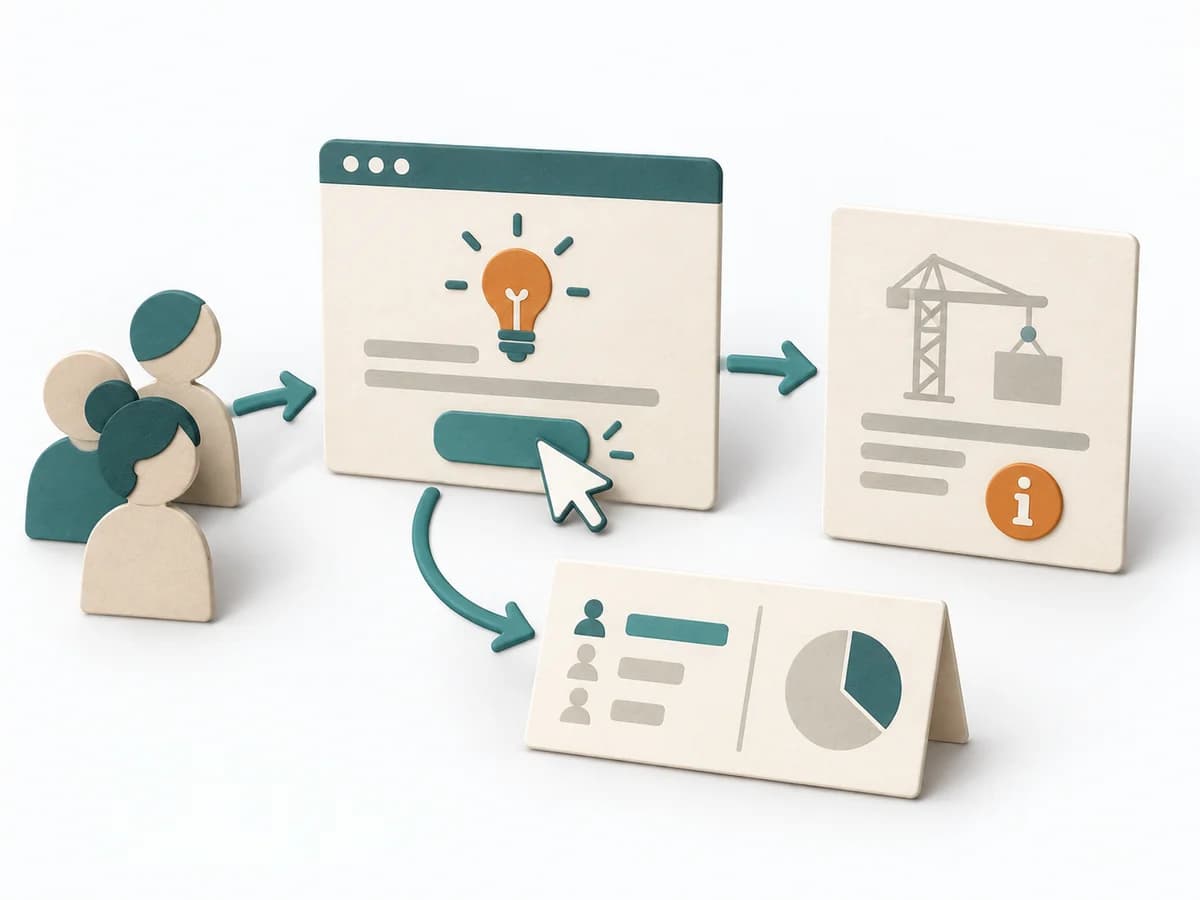 Product Discovery Fake Door Test |
|---|---|---|---|---|
Purposedifferent | When roles, interfaces, or projects fail because of differing expectations, Expectation Mapping surfaces these differences. It shows what each side takes for granted and where the pictures diverge. | When ideas need sorting quickly, it condenses impact, confidence, and effort into one compact score. It connects customer value, product logic, and decision priorities. The result is captured as an ICE table and top-ideas list. | When demand only needs to be roughly verified, it tests interest with minimal effort. It measures whether people would take a next step at all. | When demand is still unclear, it measures interest in a feature before it is built. It separates real behavior from polite agreement and deliberately keeps build effort small. |
Complexitydifferent | Low | Low | Low | Medium |
Timedifferent | 45-90 min | 30-60 min | 1-5 Tage | 1-5 Tage |
Participantsdifferent | 3-12 | 2-8 | Nutzertraffic | Nutzertraffic |
Formatdifferent | Workshop | Workshop + async | Async | Async |
Outputdifferent | Expectation Map, Alignment Notes, Agreements | ICE Table, Top Idea List | Interest Metrics, Conversion Signal, Learning Note | Click Data, Interest Signal, Learning Decision |
Tagsno overlap | AlignmentStakeholdersTeam | PrioritizationScoringGrowthDecision | ValidationExperimentsDemandGrowth | ValidationExperimentsDemandDiscovery |