View methods side by side.
Choose up to four methods. Add them using the search and share the comparison by copying its link.
| Criterion | 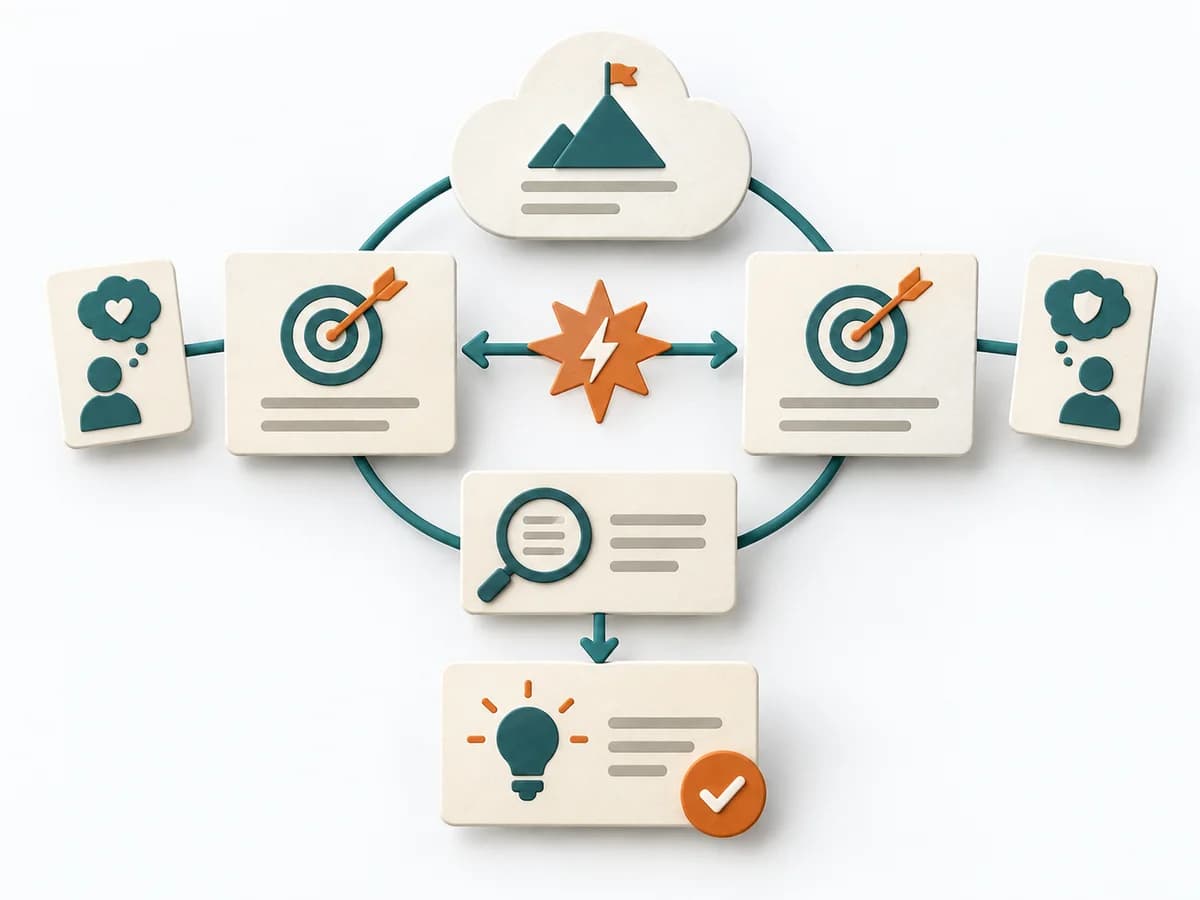 Systems Thinking Evaporating Cloud |  Product Strategy KPI Tree |  Product Strategy SMART Goals |
|---|---|---|---|
Purposedifferent | The method makes visible why two seemingly incompatible demands arise and which assumption must be tested to resolve the conflict. | When metrics across the organization drift apart, it arranges drivers and effects under one shared logic. It connects customer value, product logic, and decision priorities. The result is captured as a KPI tree and owner list. | When goals are formulated too generally, it brings measurability, direction, and timing into shape. It prevents intentions from staying without clear verification. |
Complexitydifferent | Medium | Medium | Low |
Timedifferent | 60-120 min | 90-180 min initial, dann laufend | 15-30 min |
Participantsdifferent | 2-8 | 3-8 | 1-8 |
Formatdifferent | Workshop | Workshop + async | Workshop + async |
Outputdifferent | Conflict Cloud, Assumption List, Breakthrough Ideas, Next Experiments | KPI Tree, Owner List | SMART Goal, Measurement Note, Deadline |
Tagsno overlap | Theory of ConstraintsAssumptionsSystems thinking | MetricsStrategyAlignmentMeasurement | GoalsPlanningMeasurementAlignment |
Often compared together
Methods with strong topical overlap with the current selection, not yet in the comparison.