View methods side by side.
Choose up to four methods. Add them using the search and share the comparison by copying its link.
| Criterion | 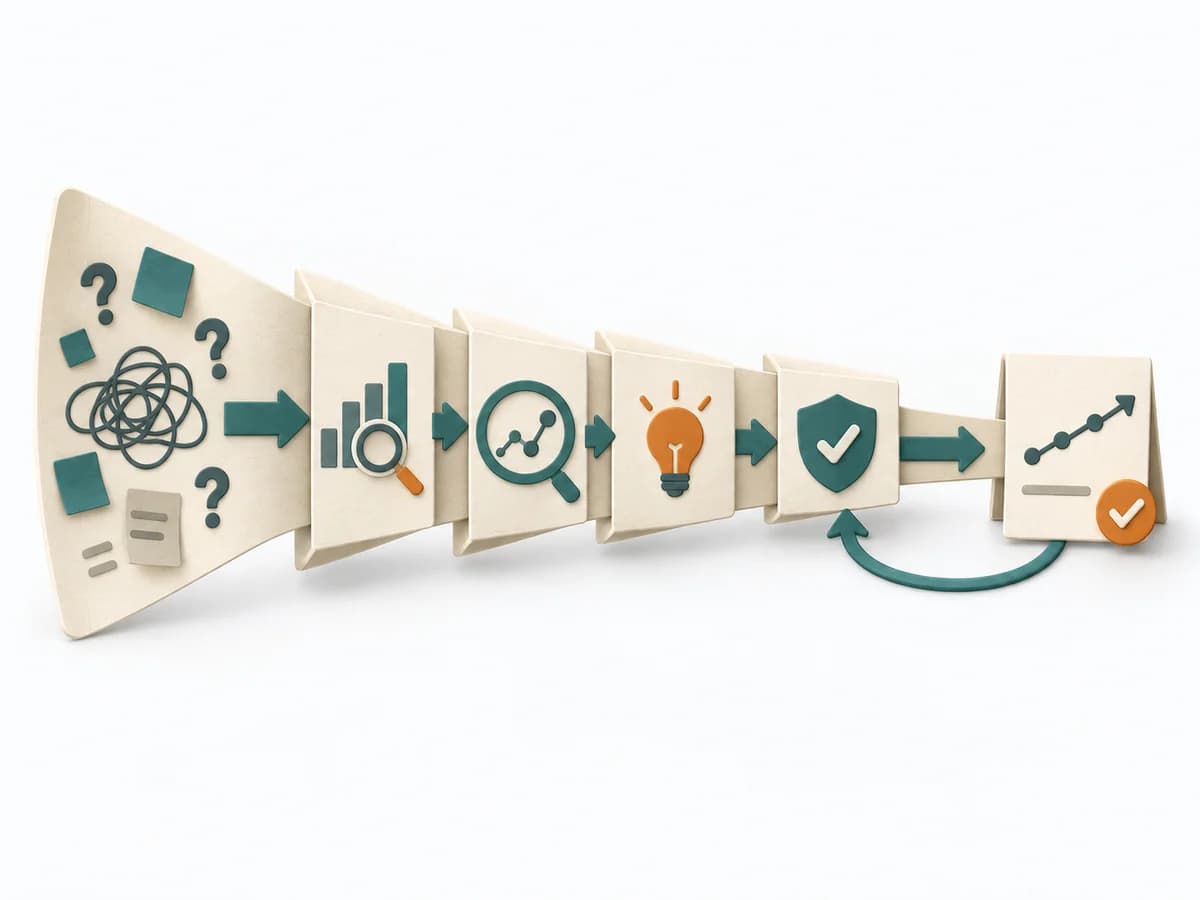 Operations DMAIC |  Delivery Value Stream Mapping | 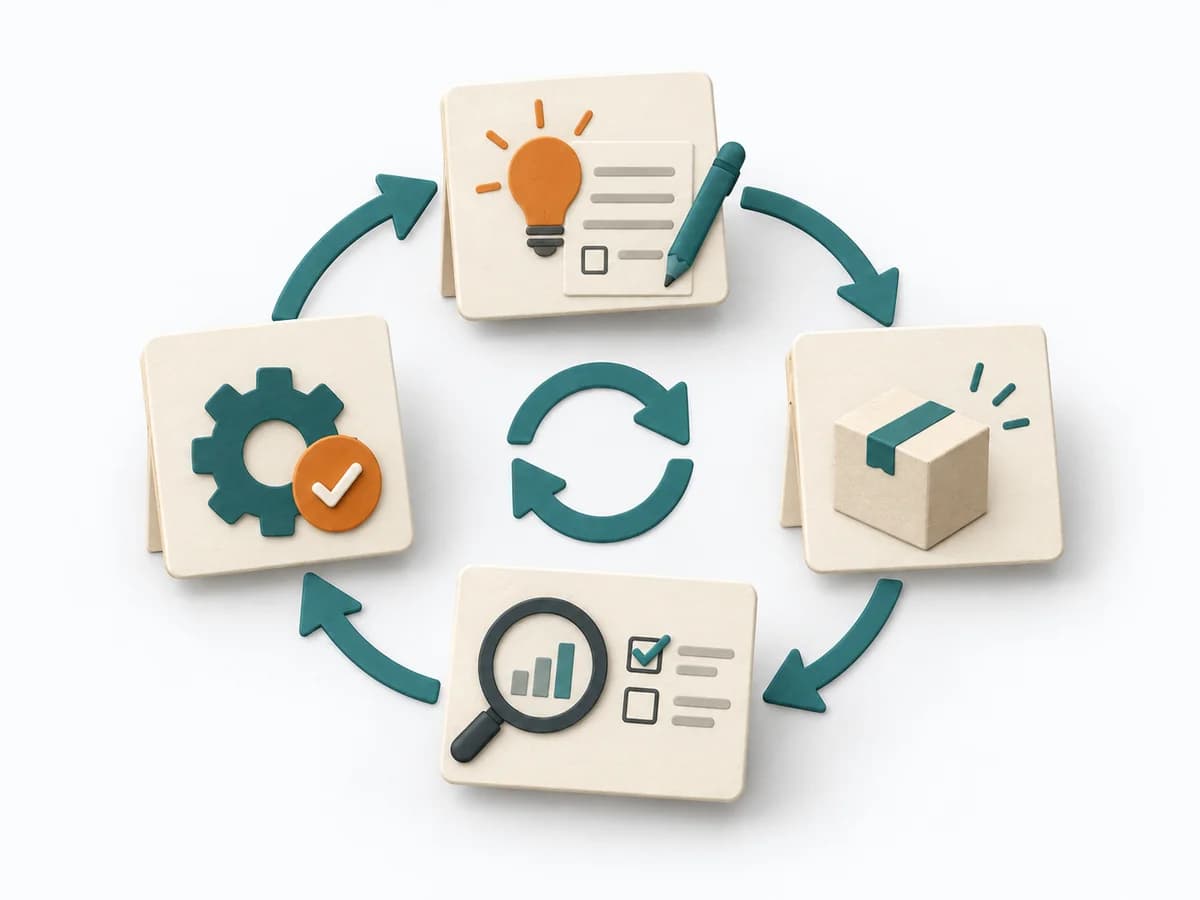 Operations PDCA Cycle | 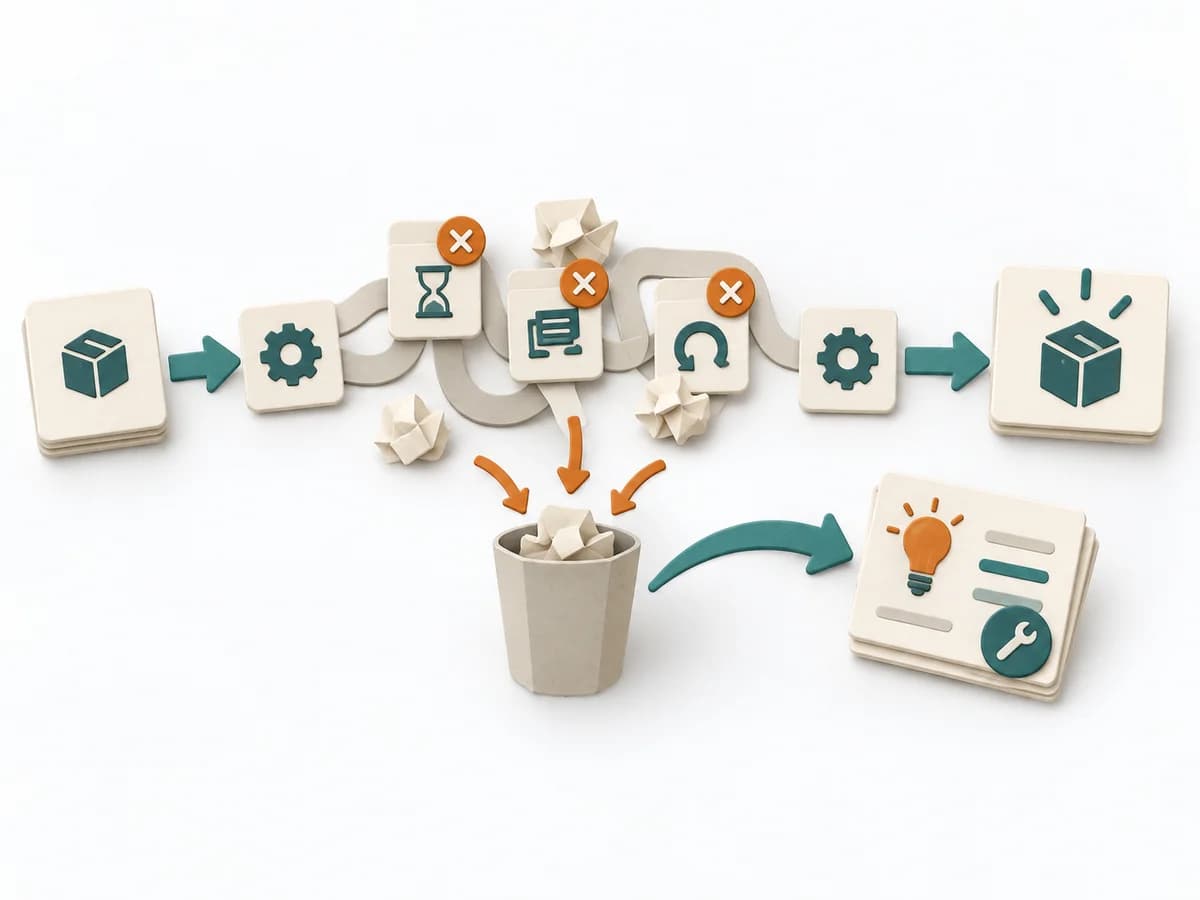 Operations Waste Analysis |
|---|---|---|---|---|
Purposedifferent | For a process problem with fluctuating performance, the method brings analysis and improvement into a disciplined sequence. It creates a framework in which numbers, causes, and control come together. | When delivery work dissolves into wait times, handoffs, and hidden effort, Value Stream Mapping makes the actual flow visible. The method exposes bottlenecks, idle time, and feedback loops so lead time and improvement levers become tangible. | For an improvement that still has to prove itself in everyday work, the method runs it through small learning loops. It connects planning, checking, and standardization into a repeatable learning mode. | For a process that keeps people busy but creates little value, the method exposes waste. It directs attention to unnecessary movement, waiting times, rework, and overdelivery. |
Complexitydifferent | High | Medium | Low | Low |
Timedifferent | 2-12 Wochen | 1-3 h | 1 h bis mehrere Wochen | 45-120 min |
Participantsdifferent | 3-10 | 4-10 | 1-8 | 2-8 |
Formatdifferent | Workshop + async | Workshop | Workshop + async | Workshop |
Outputdifferent | Project Charter, Measurement Plan, Cause Analysis, Control Plan | Current-state map, Future-state map, Bottleneck list | PDCA Log, Experiment Plan, Learning Outcome, Standard Change | Waste Map, Prioritized Waste, Improvement Backlog |
Tagsno overlap | Continuous improvementQualityProcess improvement | LeanFlowWasteDelivery | Continuous improvementLeanExperiments | WasteLeanProcess improvement |