View methods side by side.
Choose up to four methods. Add them using the search and share the comparison by copying its link.
| Criterion | 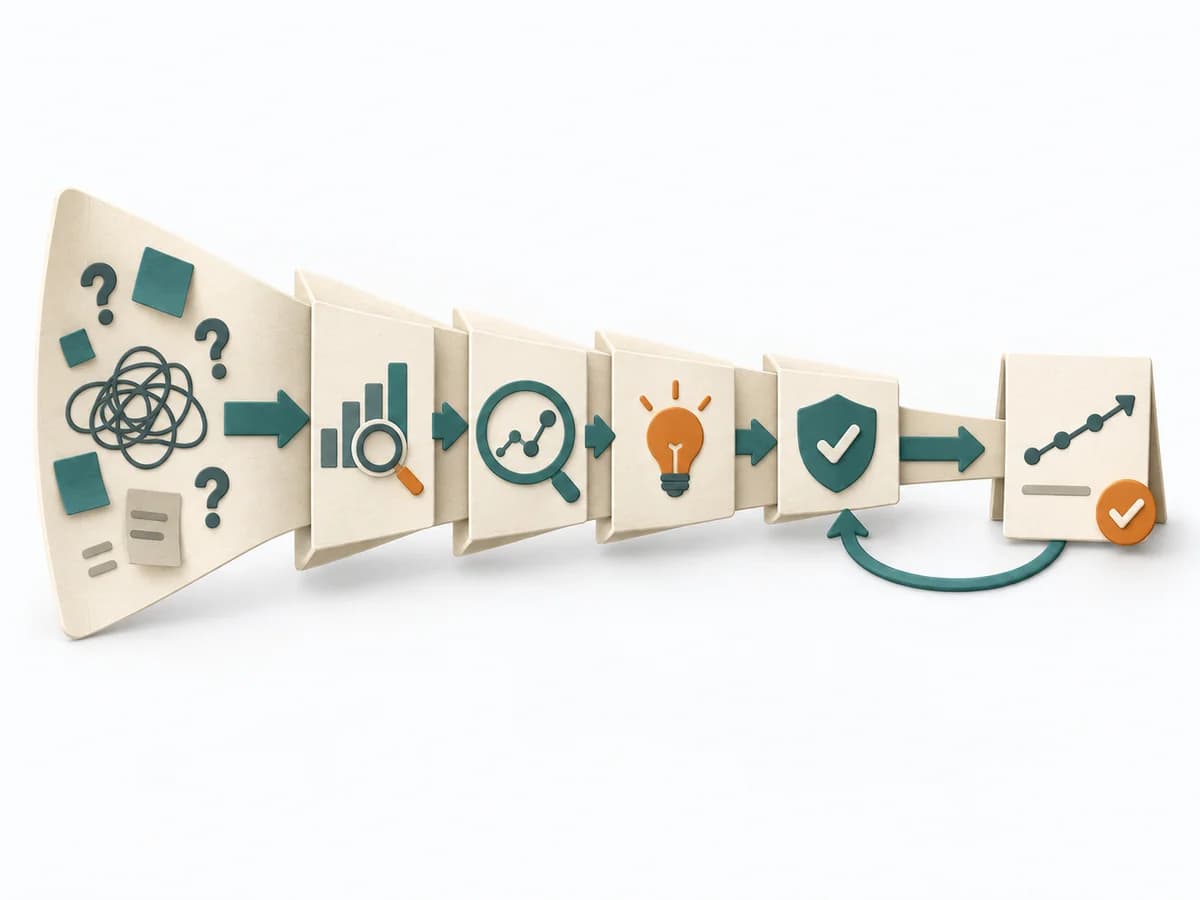 Operations DMAIC |  Product Strategy Value Proposition Canvas | 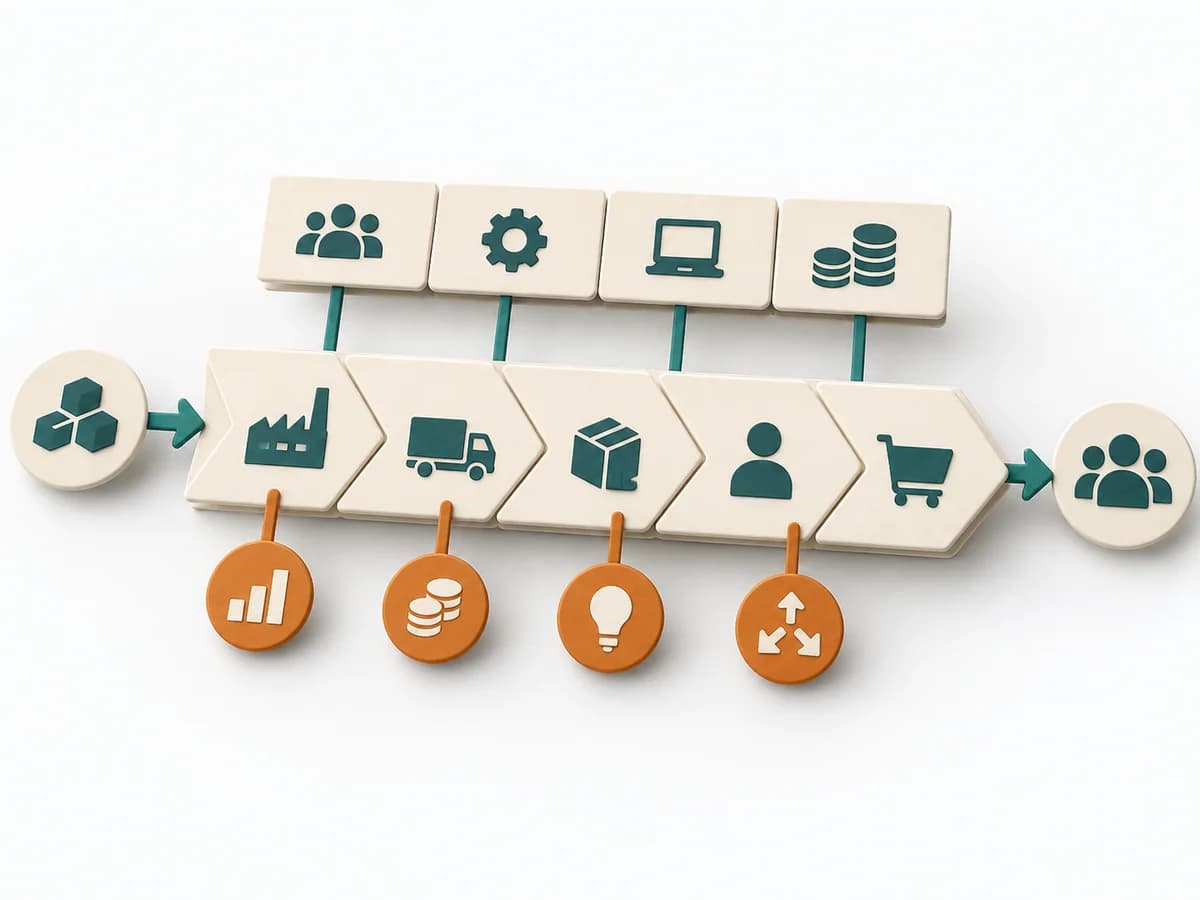 Business Strategy Value Chain Analysis | 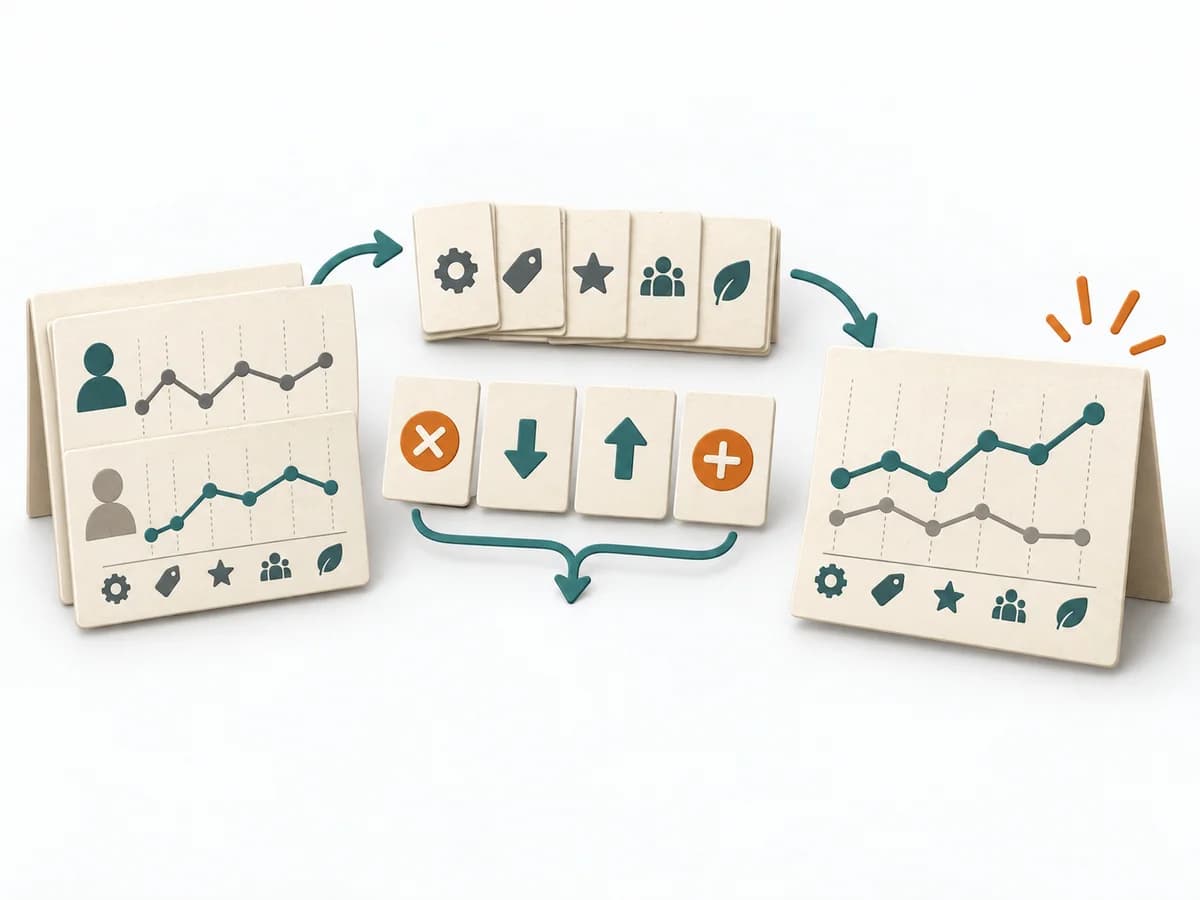 Business Strategy Blue Ocean Strategy Canvas |
|---|---|---|---|---|
Purposedifferent | For a process problem with fluctuating performance, the method brings analysis and improvement into a disciplined sequence. It creates a framework in which numbers, causes, and control come together. | When the value proposition and customer expectation drift apart, it makes fit and mismatch legible. It shows where offering and need don't yet come together. | Value Chain Analysis shows where value is created, costs accrue, and differentiation becomes possible along the process. It compares strengths, risks, market logic, and courses of action. The result is captured as a value-chain map and lever list. | The Blue Ocean Strategy Canvas shows how an offering is positioned relative to the market. Differentiation thereby becomes tangible in value factors instead of merely being claimed. |
Complexitydifferent | High | Medium | High | Medium |
Timedifferent | 2-12 Wochen | 1-2 h | Half day | 2-4 h |
Participantsdifferent | 3-10 | 2-8 | 3-8 | 3-10 |
Formatdifferent | Workshop + async | Workshop + async | Workshop | Workshop |
Outputdifferent | Project Charter, Measurement Plan, Cause Analysis, Control Plan | Value Proposition Canvas, Fit Gaps, Hypotheses | Value Chain Map, Lever List | Strategy Canvas, Value Curve, ERRC Actions |
Tagsno overlap | Continuous improvementQualityProcess improvement | ValueNeedsStrategy | StrategyBusiness modelDiagnosisAnalysis | StrategyPositioningInnovationValue |