View methods side by side.
Choose up to four methods. Add them using the search and share the comparison by copying its link.
| Criterion | 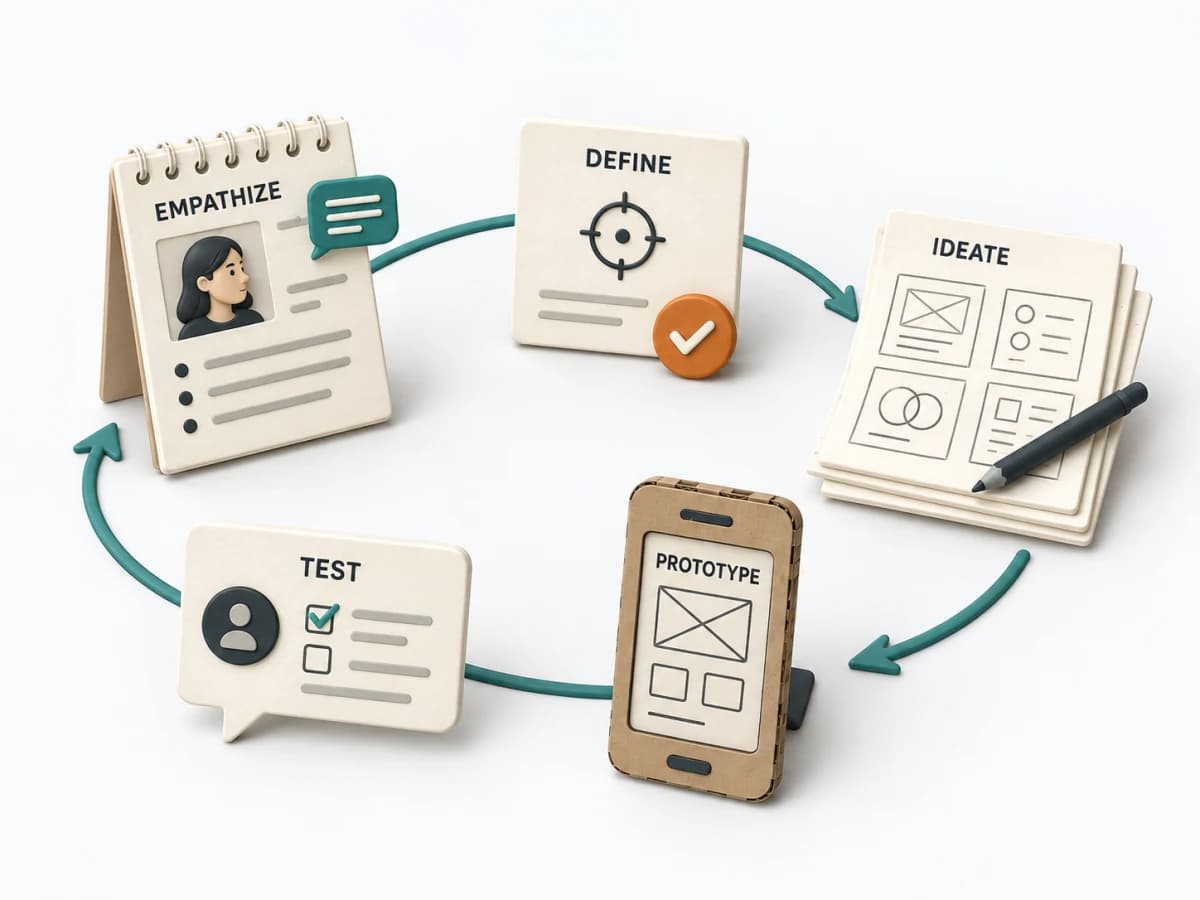 Innovation Design Thinking | 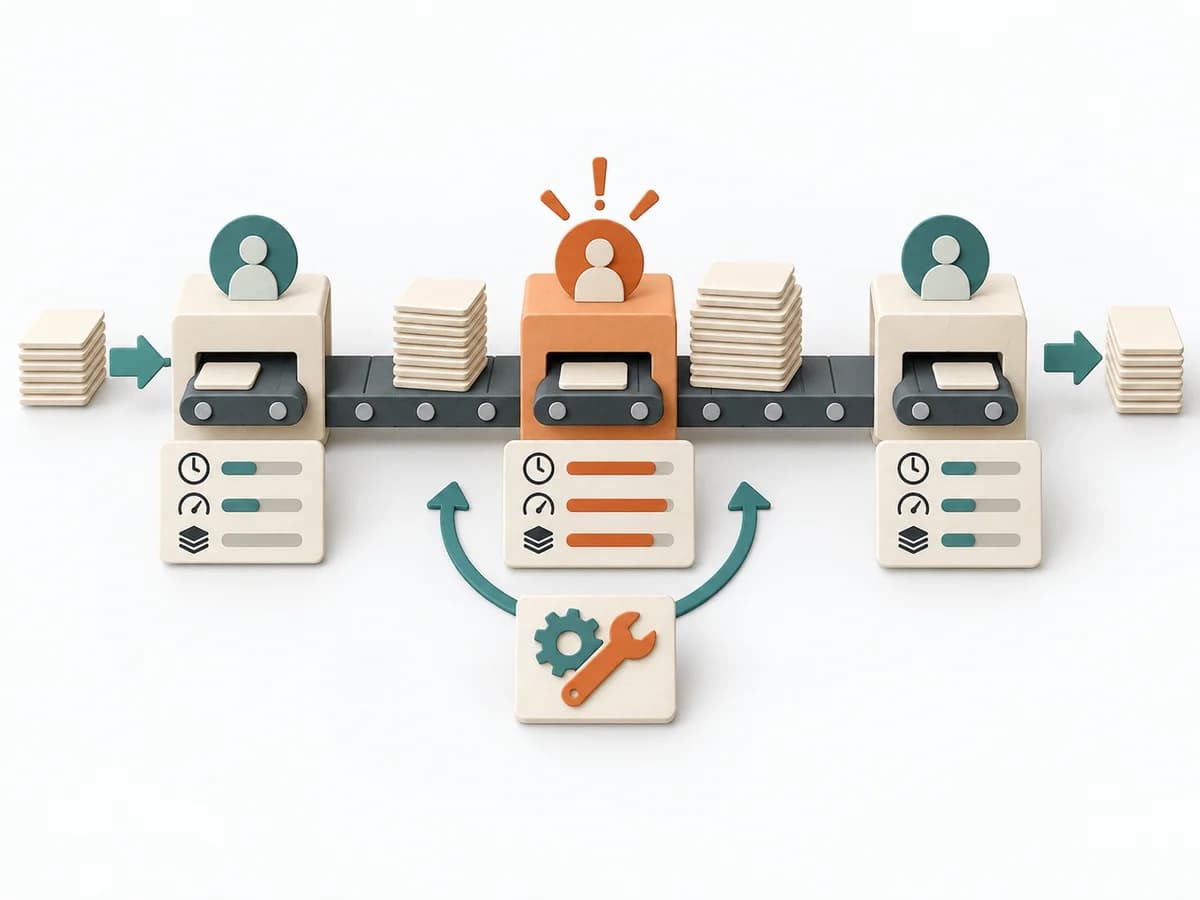 Operations Bottleneck Analysis | 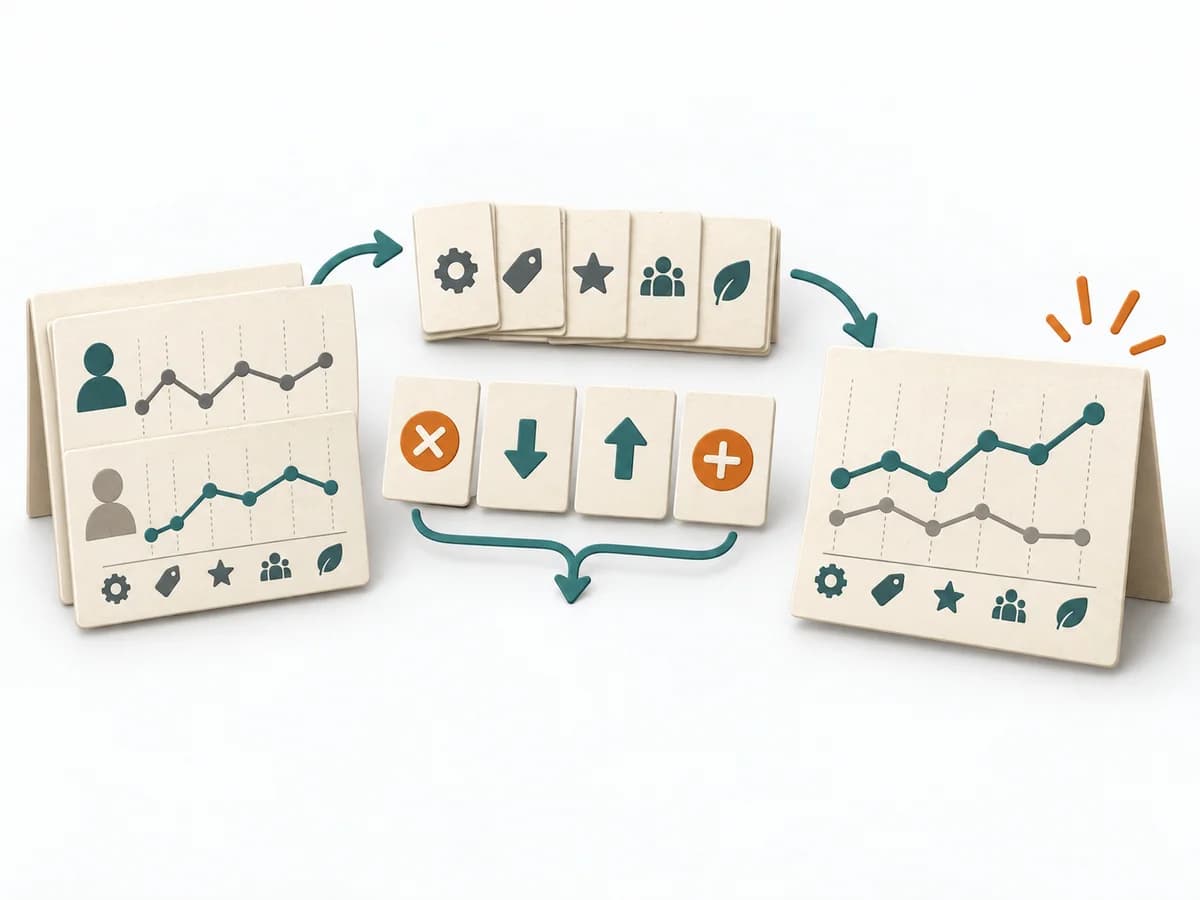 Business Strategy Blue Ocean Strategy Canvas |
|---|---|---|---|
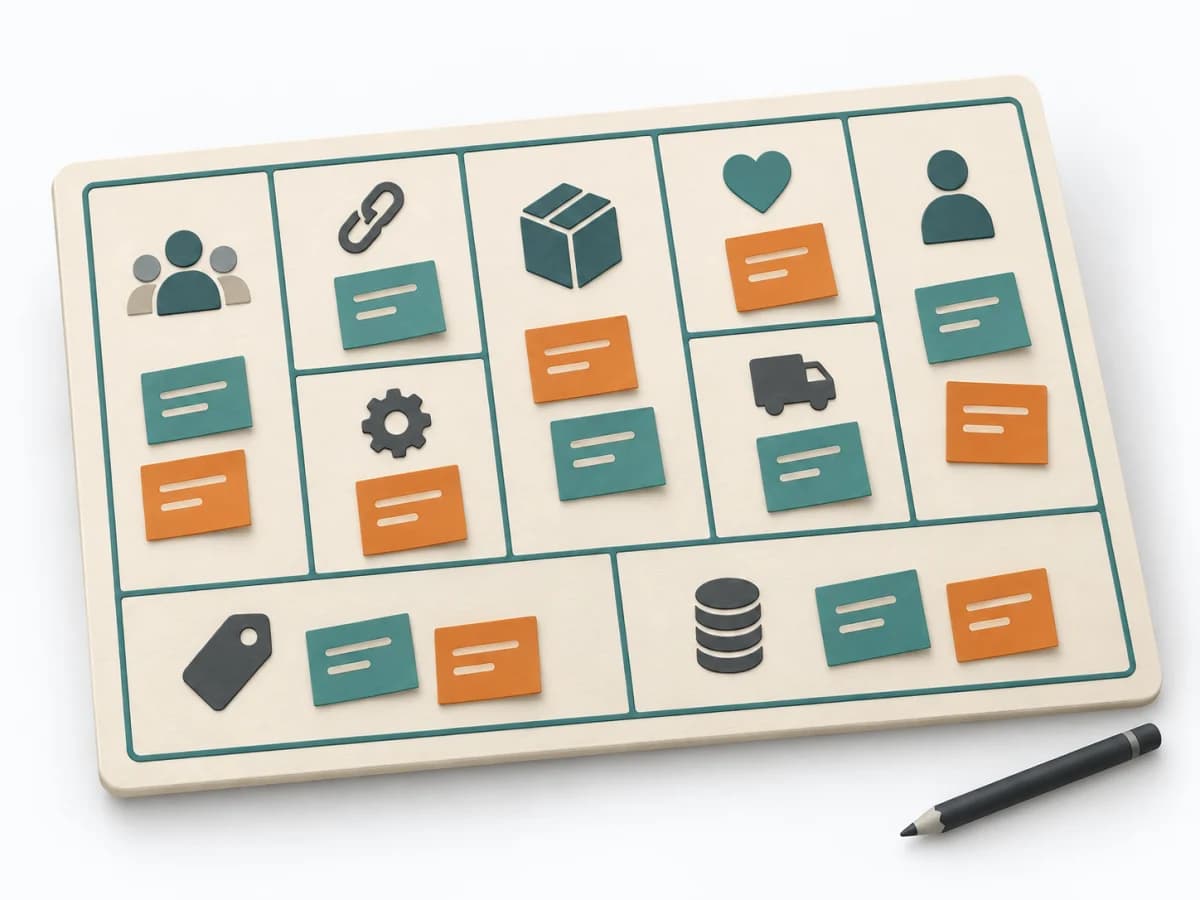
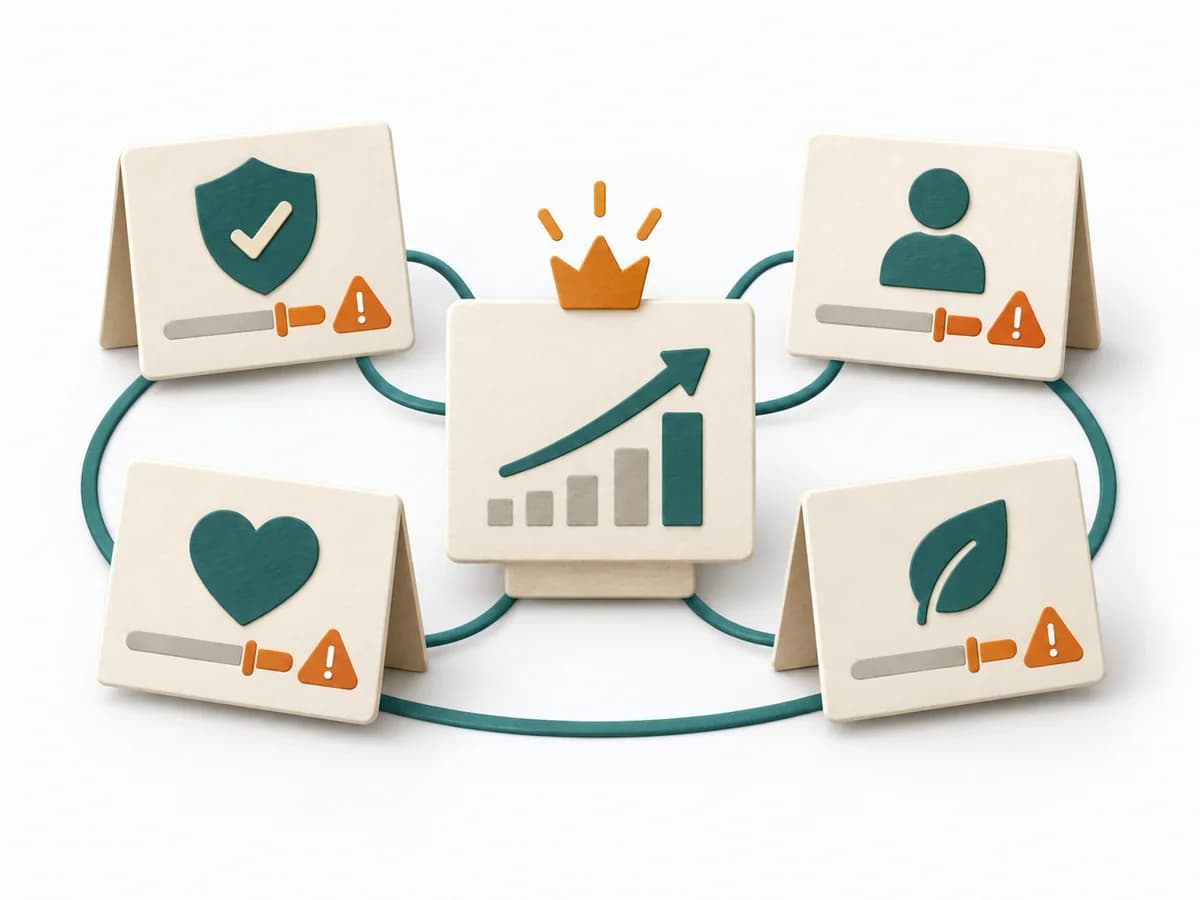
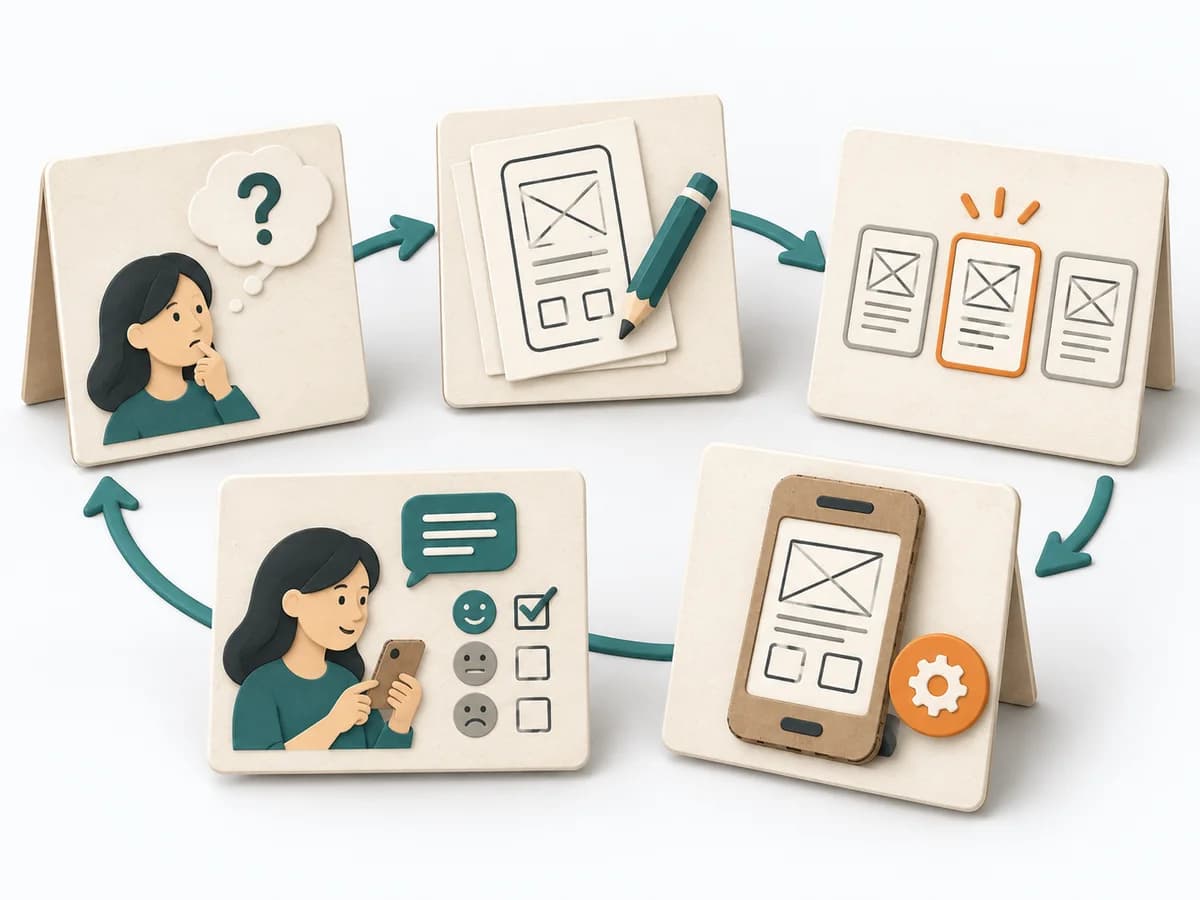
Purposedifferent | For complex user problems with an uncertain cause, the method connects observation, interpretation, and experiment into a learning cycle. It keeps the focus on real needs and avoids premature solution language. This produces robust decisions for product and service. | For a flow that backs up at one point, the method looks for the capacity limit with the greatest leverage. It explains why extra effort elsewhere barely improves throughput. | The Blue Ocean Strategy Canvas shows how an offering is positioned relative to the market. Differentiation thereby becomes tangible in value factors instead of merely being claimed. |
Complexitydifferent | High | Medium | Medium |
Timedifferent | 1 Tag bis mehrere Wochen | 1-3 h | 2-4 h |
Participantsdifferent | 4-10 | 3-8 | 3-10 |
Formatdifferent | Workshop | Workshop + async | Workshop |
Outputdifferent | Problem Statement, Prototype, Test Learnings | Bottleneck Map, Flow Metrics, Improvement Options, Follow-up Measures | Strategy Canvas, Value Curve, ERRC Actions |
Tagsno overlap | InnovationPrototypeResearch | FlowMeasurementConstraints | StrategyPositioningInnovationValue |
Often compared together
Methods with strong topical overlap with the current selection, not yet in the comparison.