View methods side by side.
Choose up to four methods. Add them using the search and share the comparison by copying its link.
| Criterion | 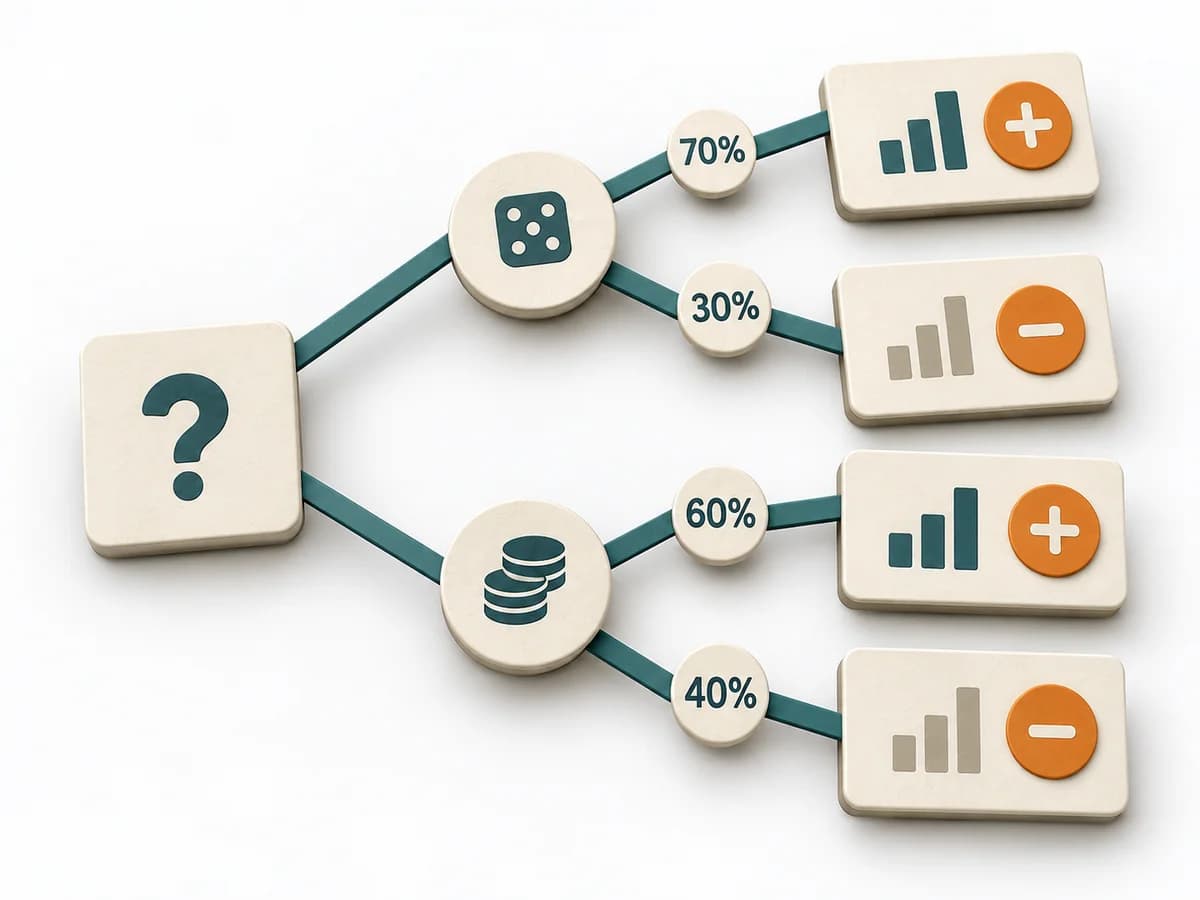 Decision Making Decision Tree | 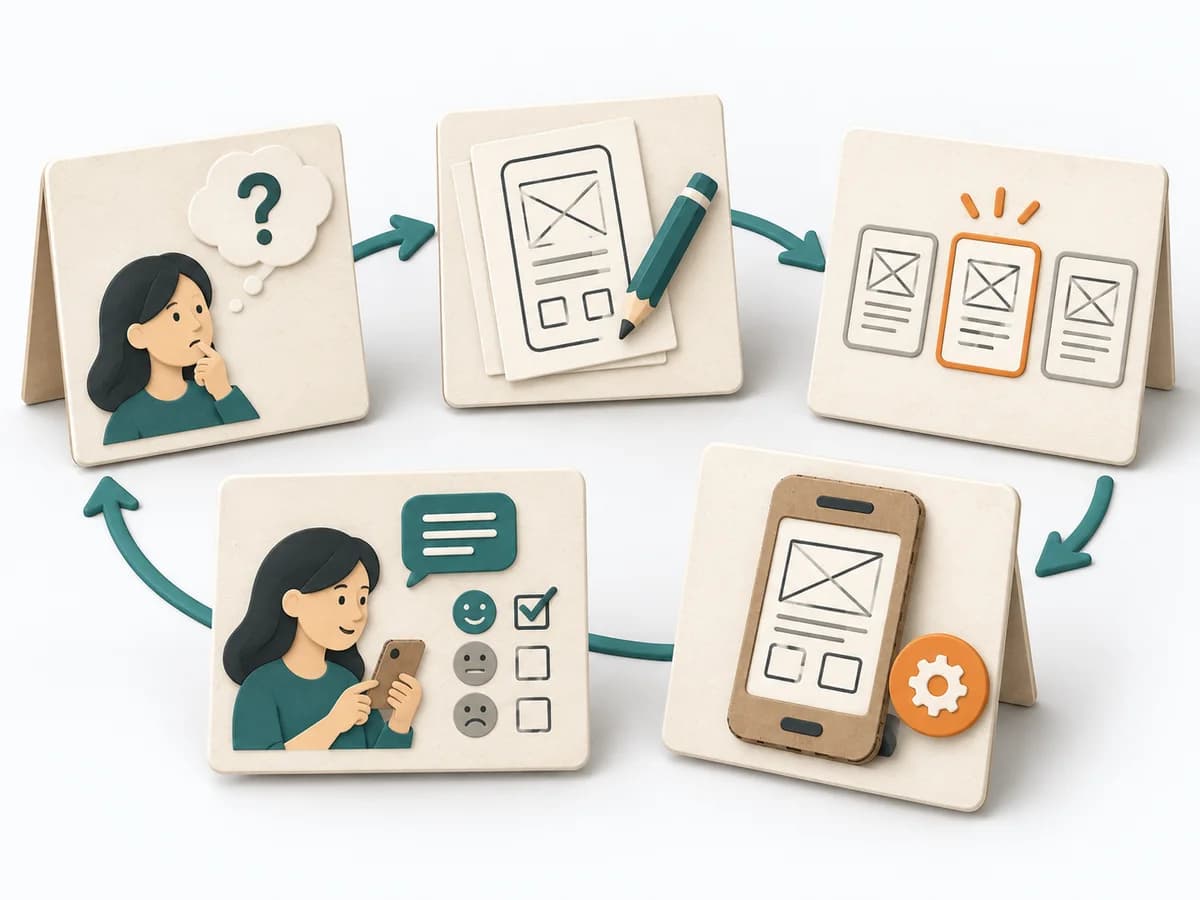 Innovation Design Sprint | 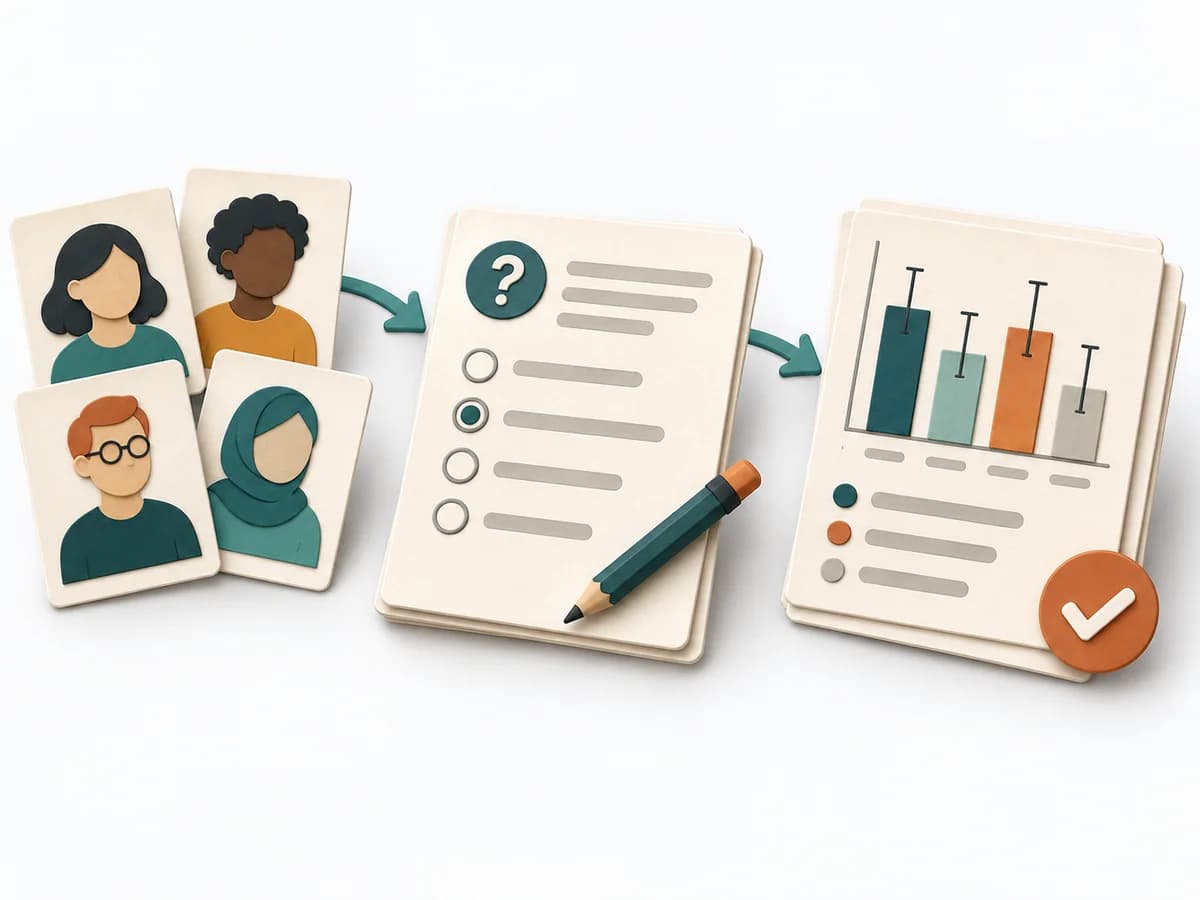 UX Research Surveys | 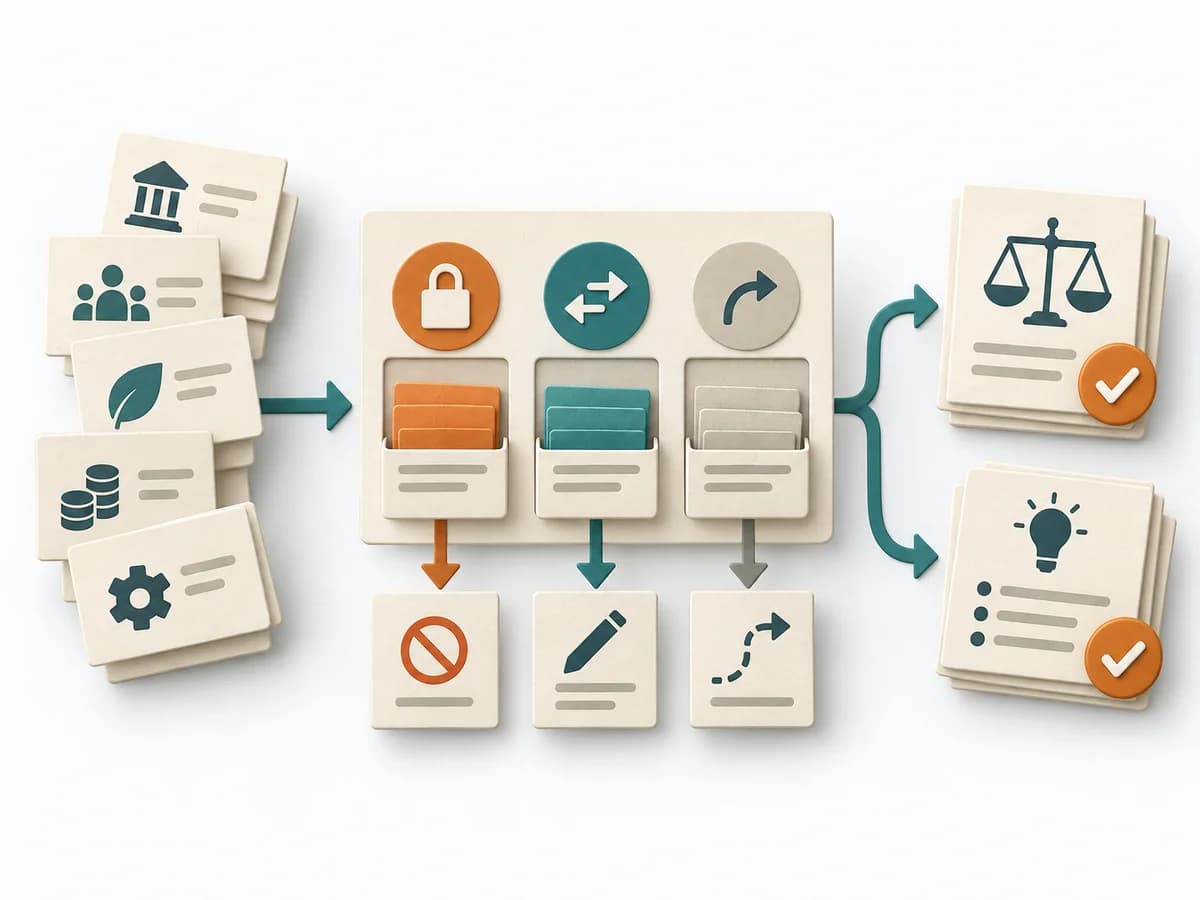 Decision Making Constraint Analysis |
|---|---|---|---|---|
Purposedifferent | For decisions with follow-on paths and dependencies, a linear comparison is often not enough. A Decision Tree shows how options branch under conditions and which consequences hang on each branch. | When the product question is unclear and time pressure is high, the method takes a team from an open idea to a testable solution. It connects problem understanding, decision, and learning in one compact format, lowering the risk of spending a lot of energy on a mere guess. | When a topic needs to be validated broadly and many people can answer the same question, surveys gather structured feedback in a scalable form. Answers become comparable and segmentable instead of remaining merely anecdotal. | When an initiative stalls, the limit often lies not in the idea but in hard or soft boundary conditions. Constraint Analysis separates these limits and shows which of them can actually be shaped. |
Complexitydifferent | Medium | High | Medium | Low |
Timedifferent | 30-90 min | 4-5 Tage | 3-14 Tage | 30-90 min |
Participantsdifferent | 1-6 | 5-8 | 50+ | 2-8 |
Formatdifferent | Workshop + async | Workshop | Async | Workshop + async |
Outputdifferent | Decision Tree, Option Map, Assumption List | Prototype, Test Findings, Decision Rationale | Survey Results, Charts, Segment Insights | Constraint List, Hard/Soft Classification, Option Impact Notes, Decision Boundaries |
Tagsno overlap | DecisionTreeOptions | Design sprintPrototypeValidationInnovation | QuantitativeResearchValidation | ConstraintsDecisionPlanningOptions |