View methods side by side.
Choose up to four methods. Add them using the search and share the comparison by copying its link.
| Criterion | 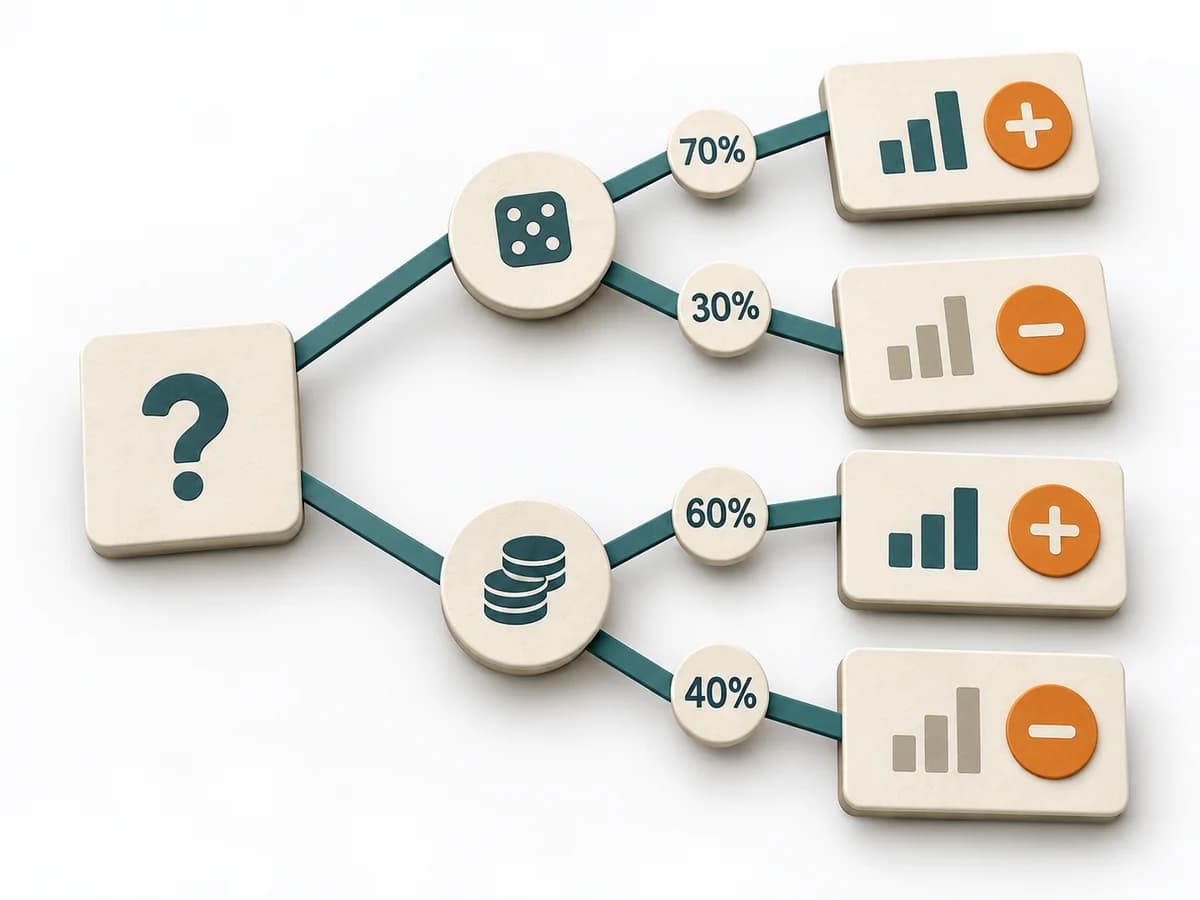 Decision Making Decision Tree | 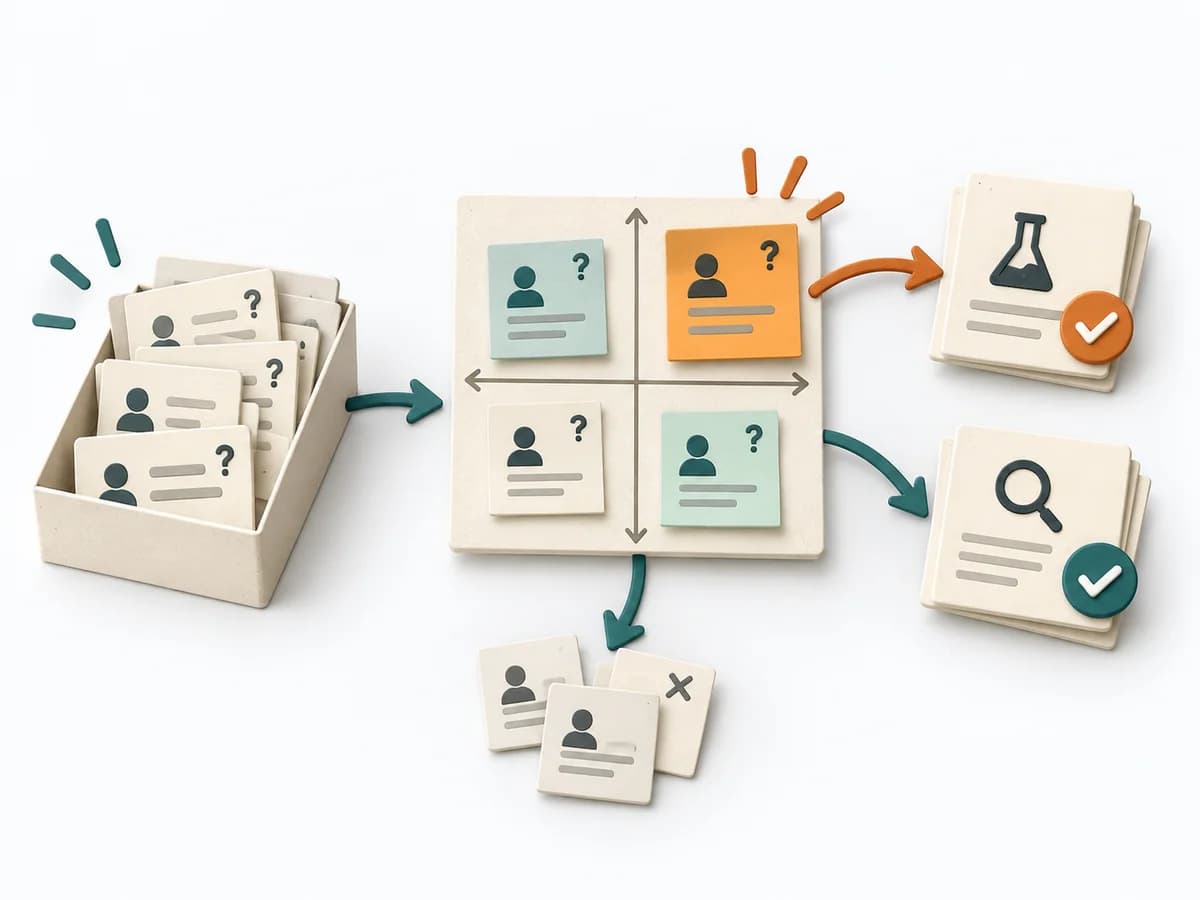 Decision Making Assumption Surfacing | 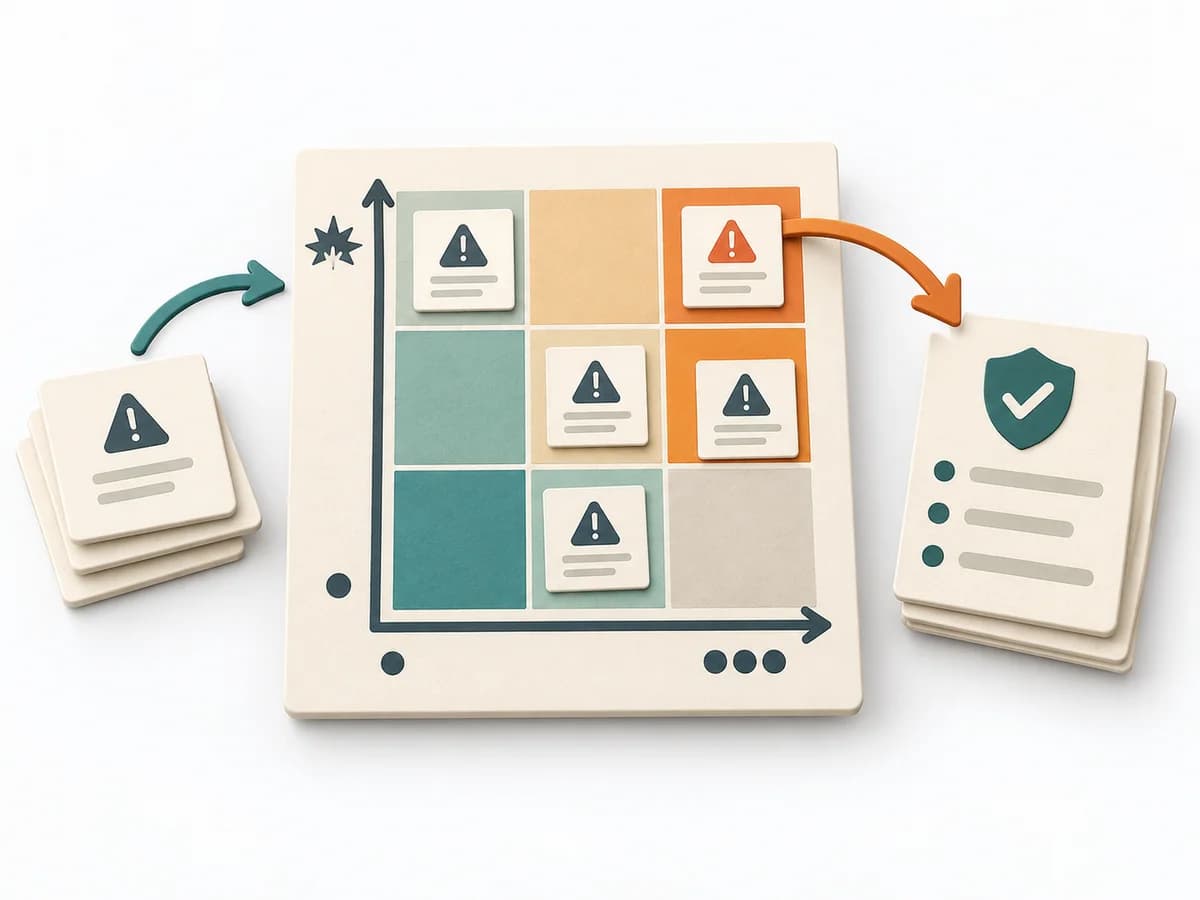 Decision Making Risk Matrix | 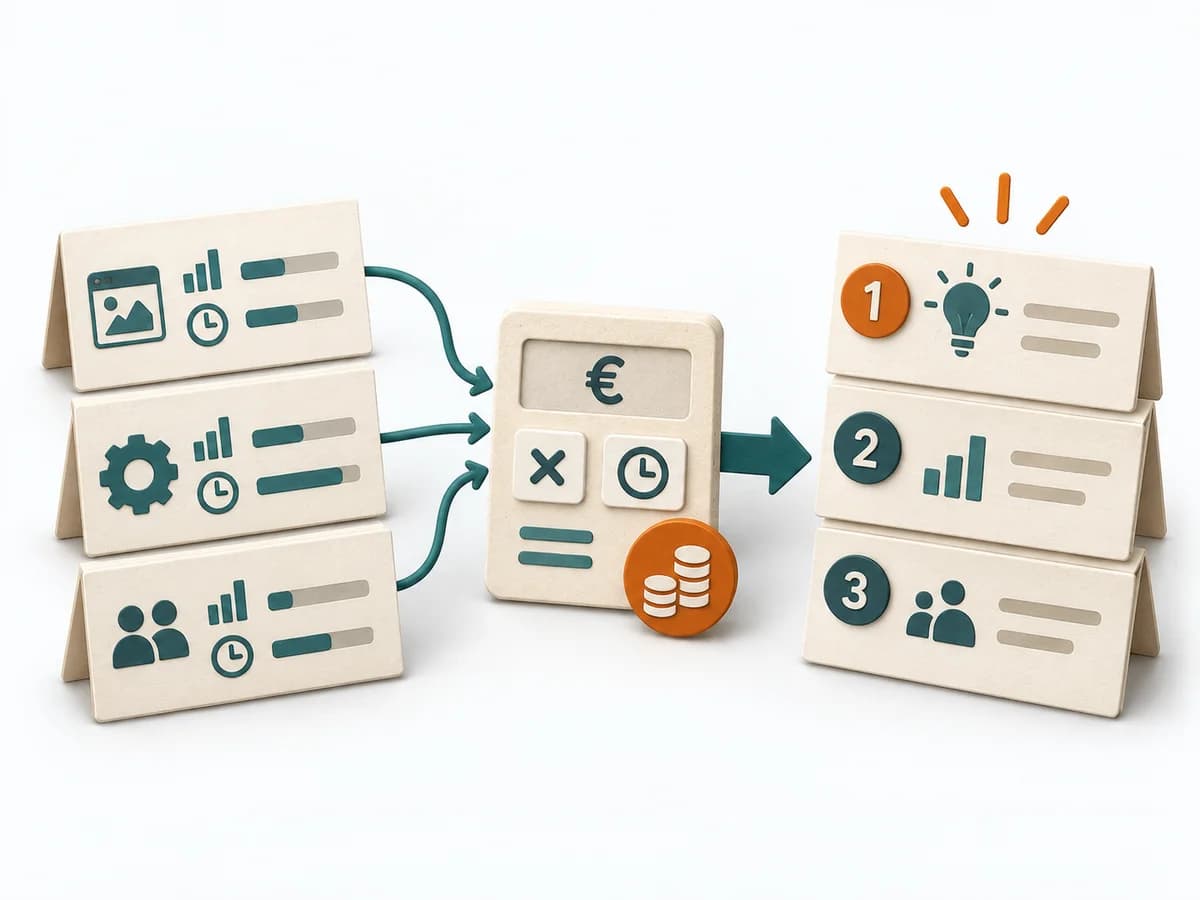 Delivery Cost of Delay |
|---|---|---|---|---|
Purposedifferent | For decisions with follow-on paths and dependencies, a linear comparison is often not enough. A Decision Tree shows how options branch under conditions and which consequences hang on each branch. | Plans often contain assumptions that were never openly stated and remain dangerous precisely because of that. Assumption Surfacing makes these silent premises visible and prioritizes which of them carry the initiative or could sink it. | When a project faces many possible disruptions, it quickly becomes unclear which risks deserve attention first. It separates options, evaluation criteria, and open risks. The result is captured as a Risk Matrix and a Top Risk List. | Helps clarify scope, order, and delivery flow in concrete terms. It makes work, constraints, and sequence manageable. The result is captured as a Cost of Delay table and prioritization sequence. |
Complexitydifferent | Medium | Low | Low | High |
Timedifferent | 30-90 min | 45-90 min | 30-60 min | 90-180 min |
Participantsdifferent | 1-6 | 2-8 | 3-10 | 3-8 |
Formatdifferent | Workshop + async | Workshop + async | Workshop + async | Workshop |
Outputdifferent | Decision Tree, Option Map, Assumption List | Assumption List, Critical Assumptions, Learning Plan | Risk Matrix, Top Risk List | CoD Table, Prioritization Sequence |
Tags1 shared | DecisionTreeOptions | AssumptionsRiskDecisionDiscovery | RiskDecisionPrioritizationAssessment | PrioritizationDeliveryEconomicsDecision |