View methods side by side.
Choose up to four methods. Add them using the search and share the comparison by copying its link.
| Criterion | 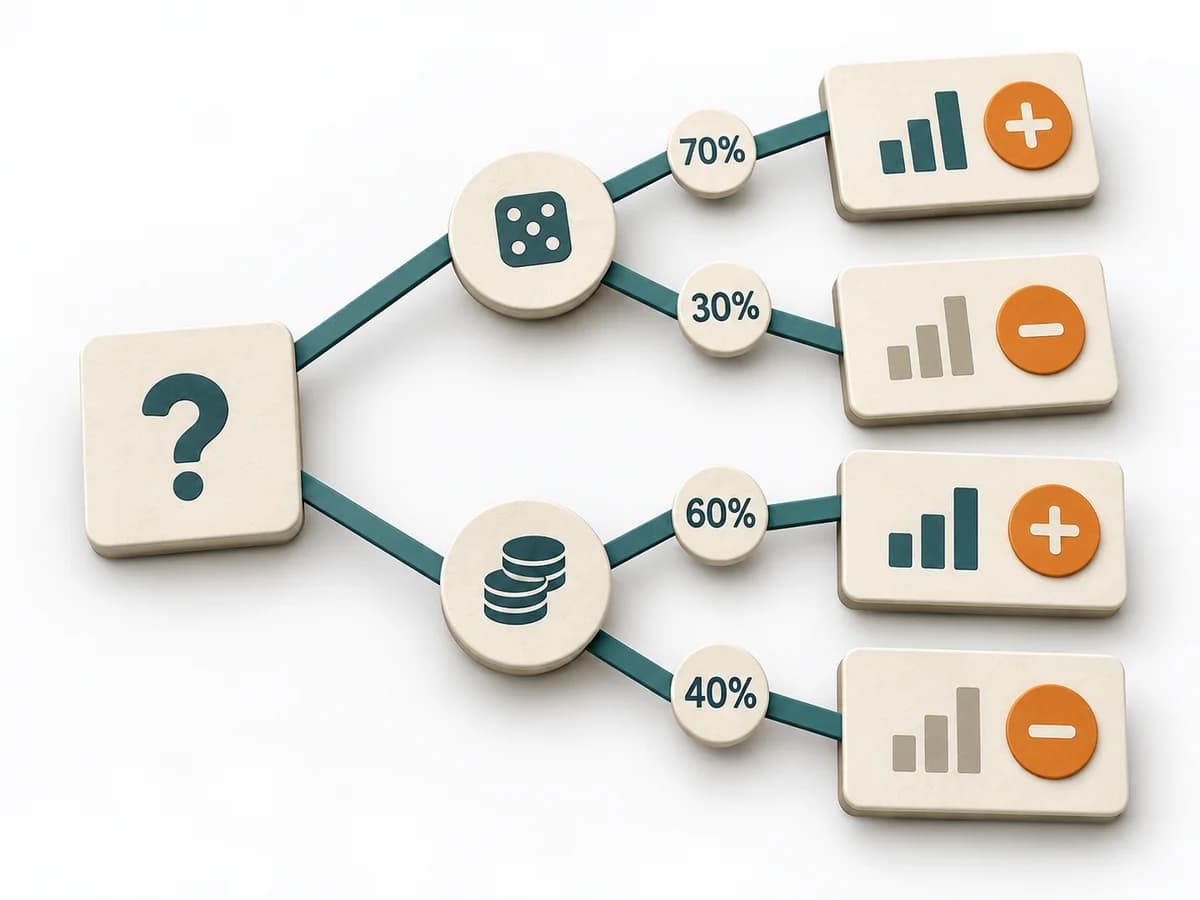 Decision Making Decision Tree |  Product Discovery Assumption Mapping | 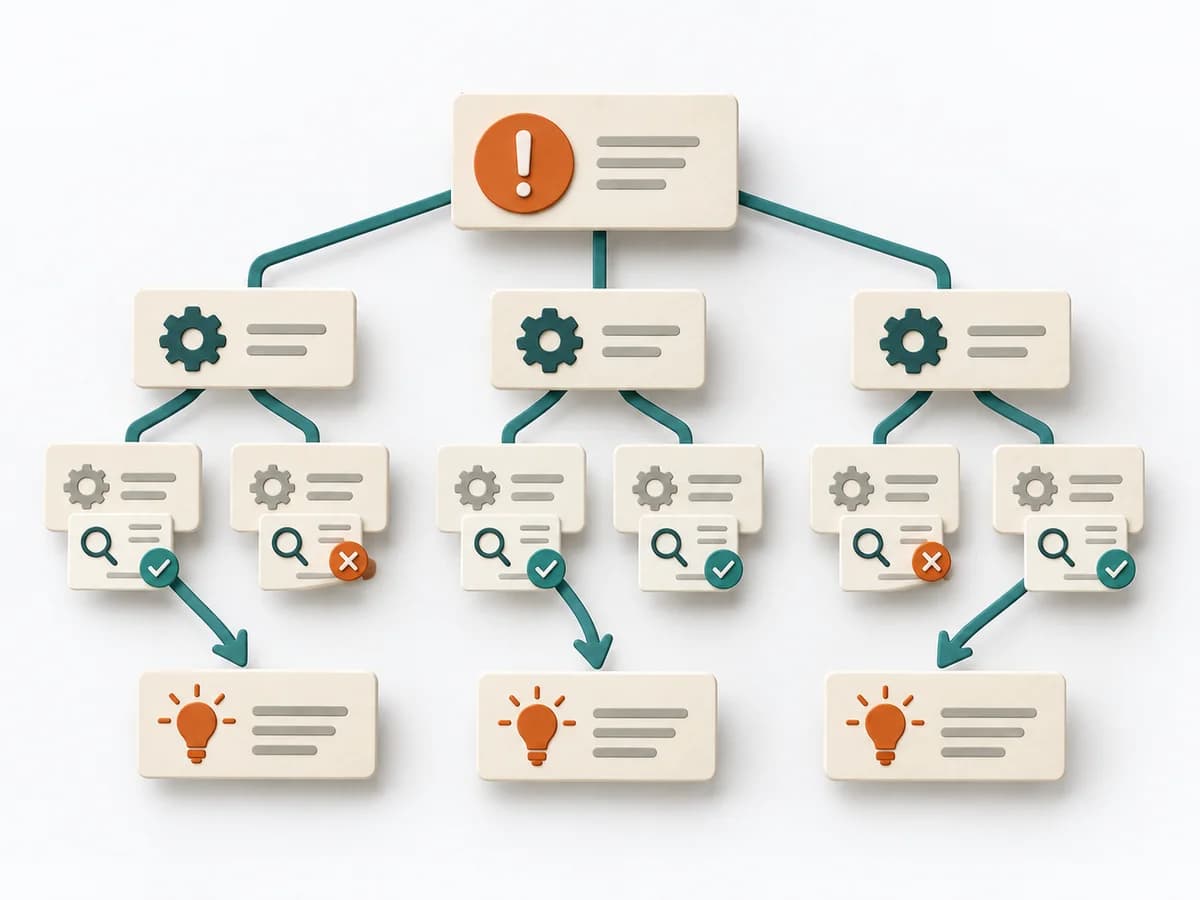 Operations Root Cause Tree Analysis |  Operations Failure Mode and Effects Analysis |
|---|---|---|---|---|
Purposedifferent | For decisions with follow-on paths and dependencies, a linear comparison is often not enough. A Decision Tree shows how options branch under conditions and which consequences hang on each branch. | When assumptions still sit unordered in the room, it weighs uncertainty against leverage. It makes visible which hypotheses should be checked first. | For a problem with several suspected causes, the method builds a causal structure instead of a mere list. It makes visible how causes connect and where the strongest points of leverage lie. | For a process, product, or service with noticeable failure risks, the method assesses possible failure modes in advance. It directs attention to combinations of occurrence, effect, and detectability. |
Complexitydifferent | Medium | Medium | Medium | High |
Timedifferent | 30-90 min | 45-60 min | 1-3 h | 2-6 h |
Participantsdifferent | 1-6 | 2-8 | 2-8 | 3-10 |
Formatdifferent | Workshop + async | Workshop + async | Workshop | Workshop |
Outputdifferent | Decision Tree, Option Map, Assumption List | Assumption map, Test backlog, Risk ranking | Cause Tree, Evidence Notes, Countermeasures | FMEA Table, Risk Priority, Mitigation Actions |
Tagsno overlap | DecisionTreeOptions | AssumptionsRiskExperimentsValidation | Root causeTreeIncidentQuality | RiskQualityOperationsRoot cause |