View methods side by side.
Choose up to four methods. Add them using the search and share the comparison by copying its link.
| Criterion |  UX Design Customer Journey Canvas | 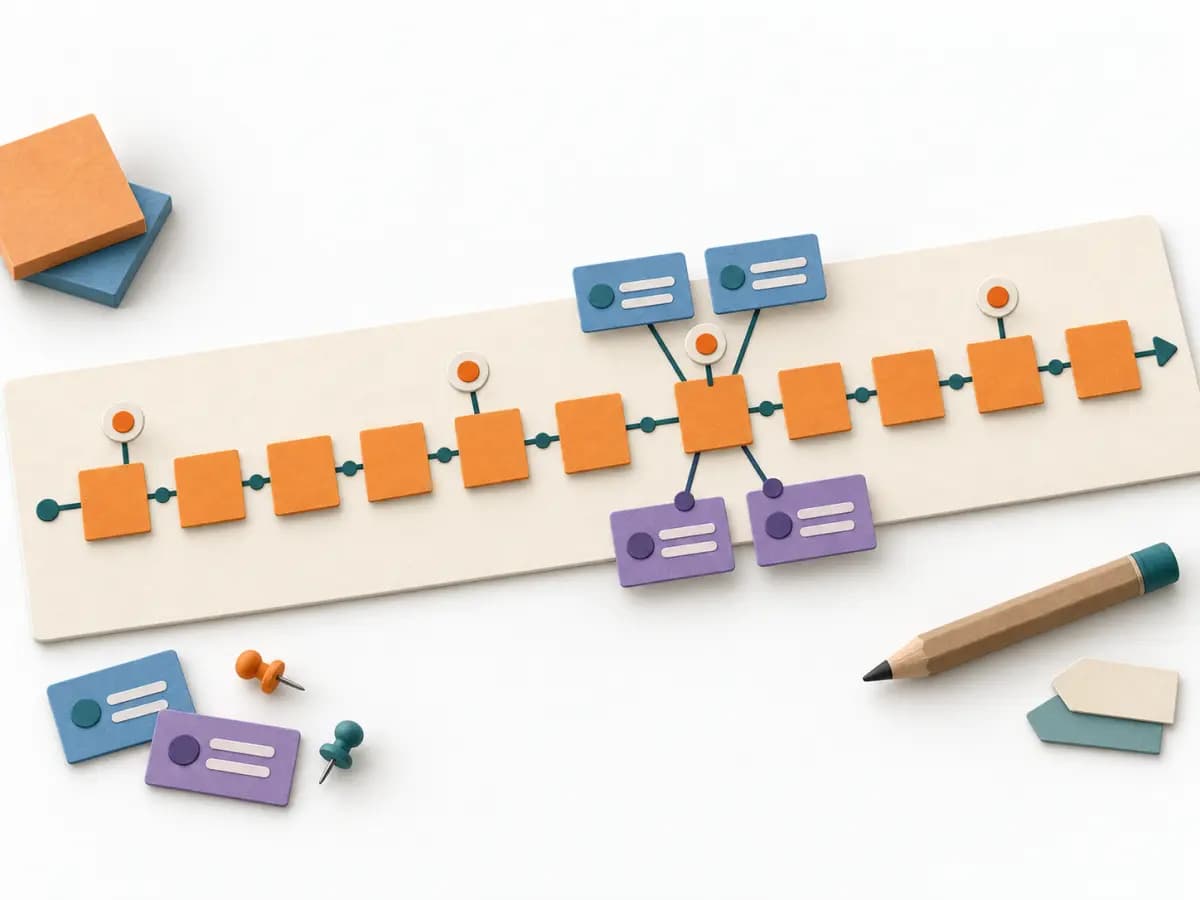 Domain Modeling EventStorming | 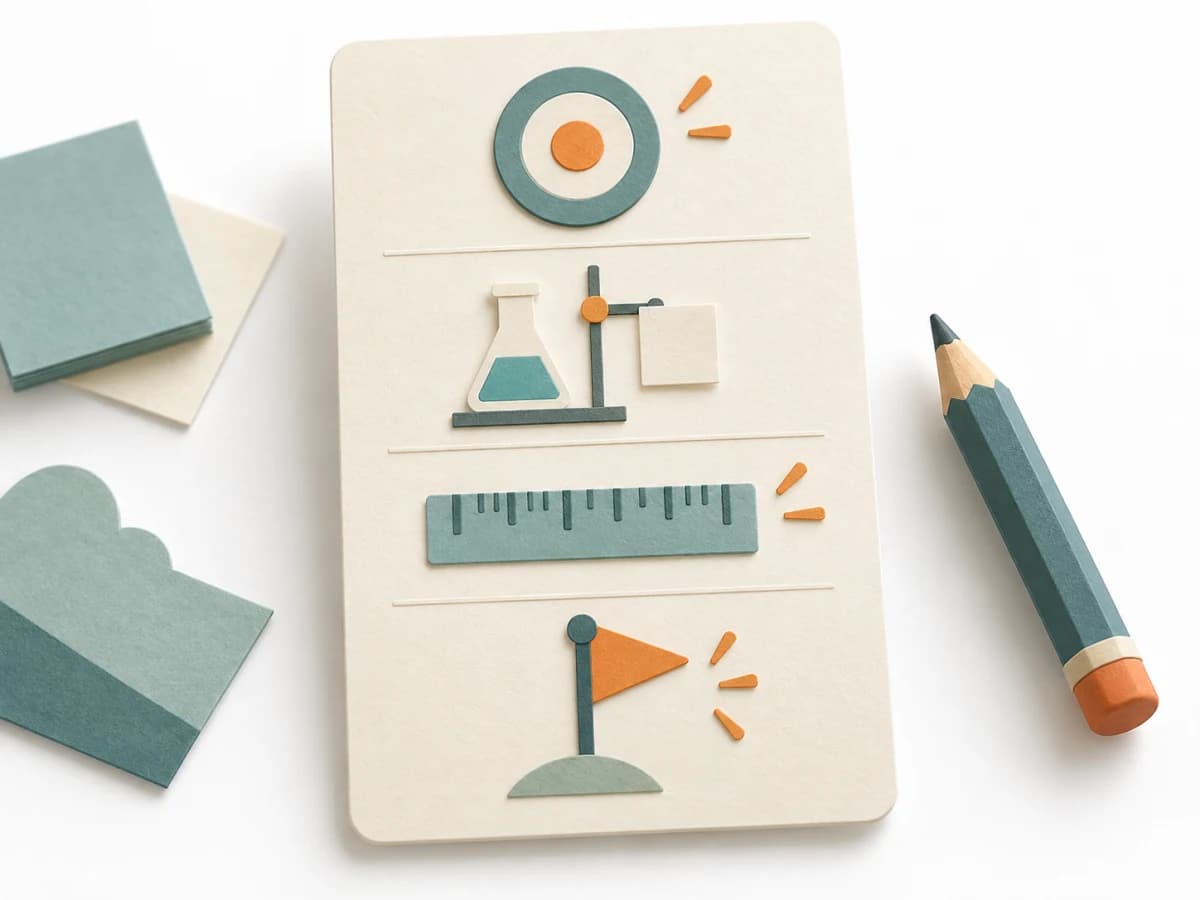 Product Discovery Test Card | 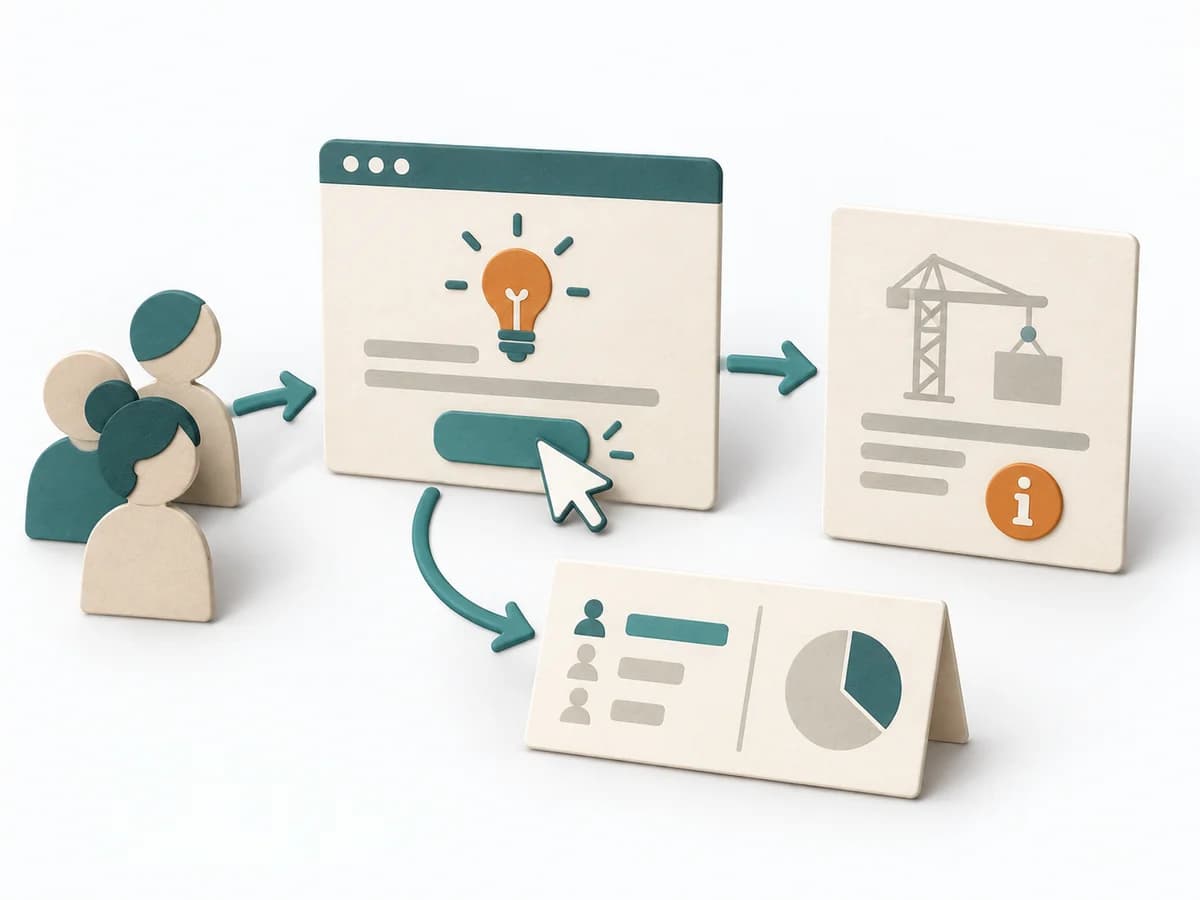 Product Discovery Fake Door Test |
|---|---|---|---|---|
Purposedifferent | When a journey needs to be understood across several phases, it arranges experience, touchpoints, and opportunities into one picture. It makes gaps and friction along the user path clear. | When a domain consists of many events, rules, and states, it creates a shared modeling space for the team. It bundles language, flows, and boundaries before domain knowledge fragments into siloed views. | The Test Card turns a critical assumption into a testable claim and specifies in advance which result counts as success. | When demand is still unclear, it measures interest in a feature before it is built. It separates real behavior from polite agreement and deliberately keeps build effort small. |
Complexitydifferent | Medium | Medium | Low | Medium |
Timedifferent | 1-3 h | 2-8 h | 20-35 min | 1-5 Tage |
Participantsdifferent | 3-10 | 5-12 | 1-5 | Nutzertraffic |
Formatdifferent | Workshop | Workshop | Workshop + async | Async |
Outputdifferent | Customer Journey Canvas, Pain Points, Experience Opportunities | Event Timeline, Ubiquitous Language, Boundaries, Open Questions | Test Card with a pre-set threshold | Click Data, Interest Signal, Learning Decision |
Tagsno overlap | JourneyCustomerService designCanvas | Domain-Driven DesignEventsDiscoveryWorkshop | ExperimentsValidationDiscoveryHypothesis | ValidationExperimentsDemandDiscovery |