View methods side by side.
Choose up to four methods. Add them using the search and share the comparison by copying its link.
| Criterion | 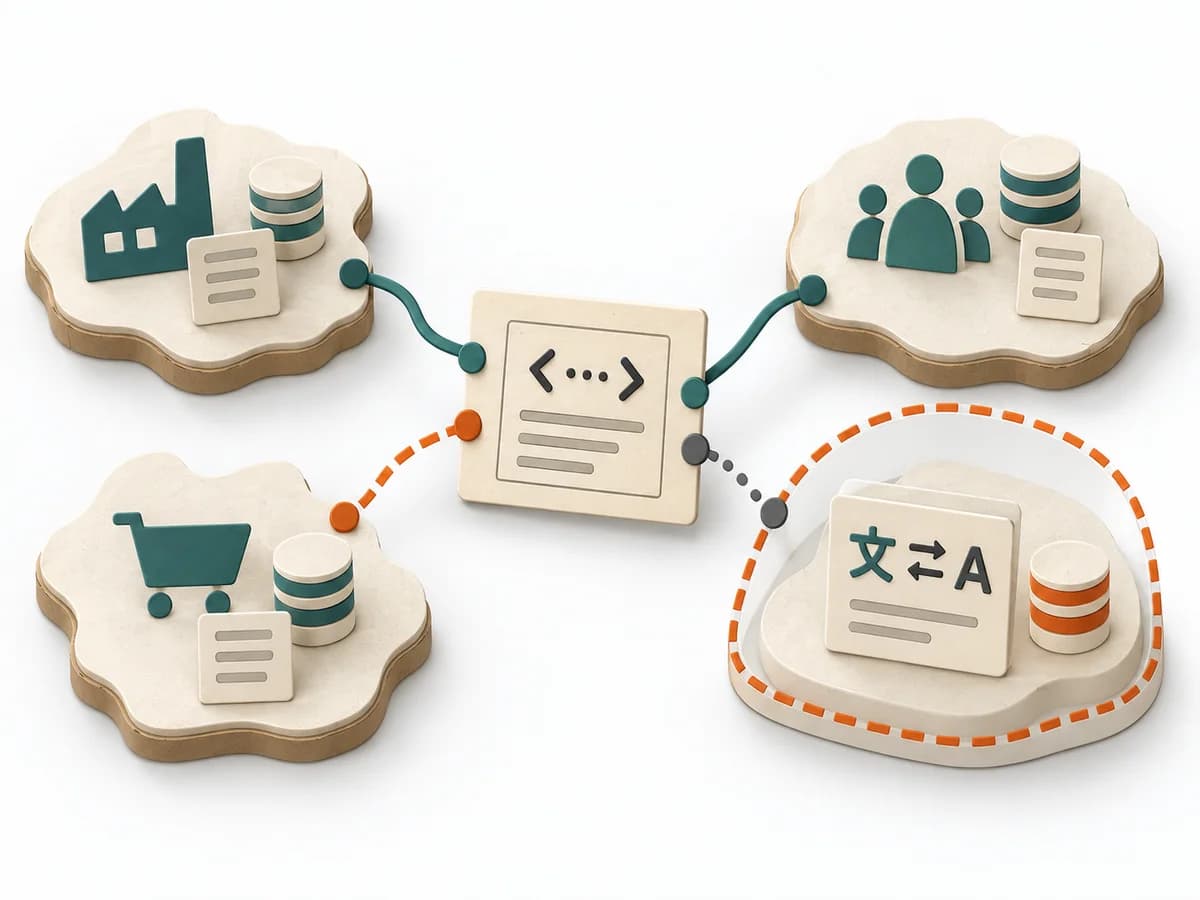 Domain Modeling Context Map |  Systems Thinking Behavior Over Time Graph | 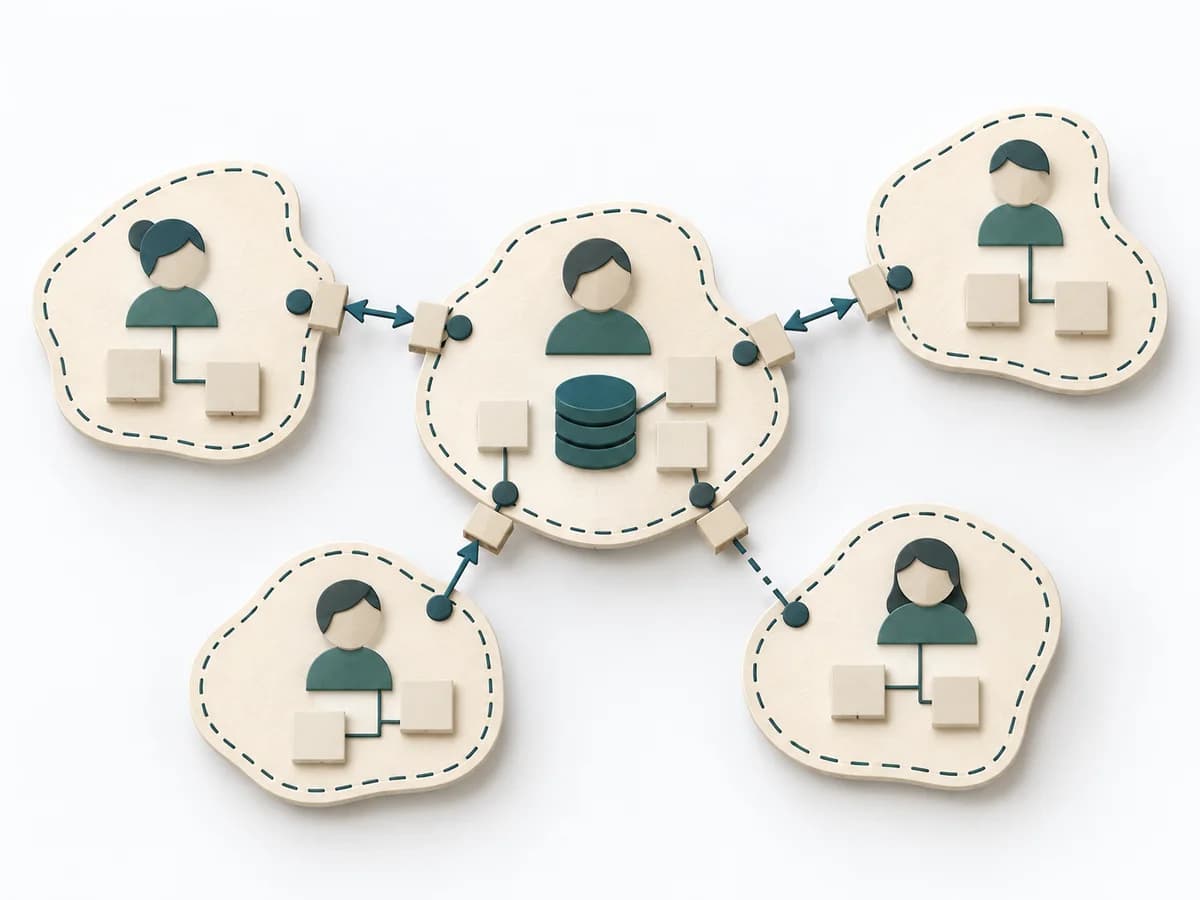 Domain Modeling Domain Context Map | 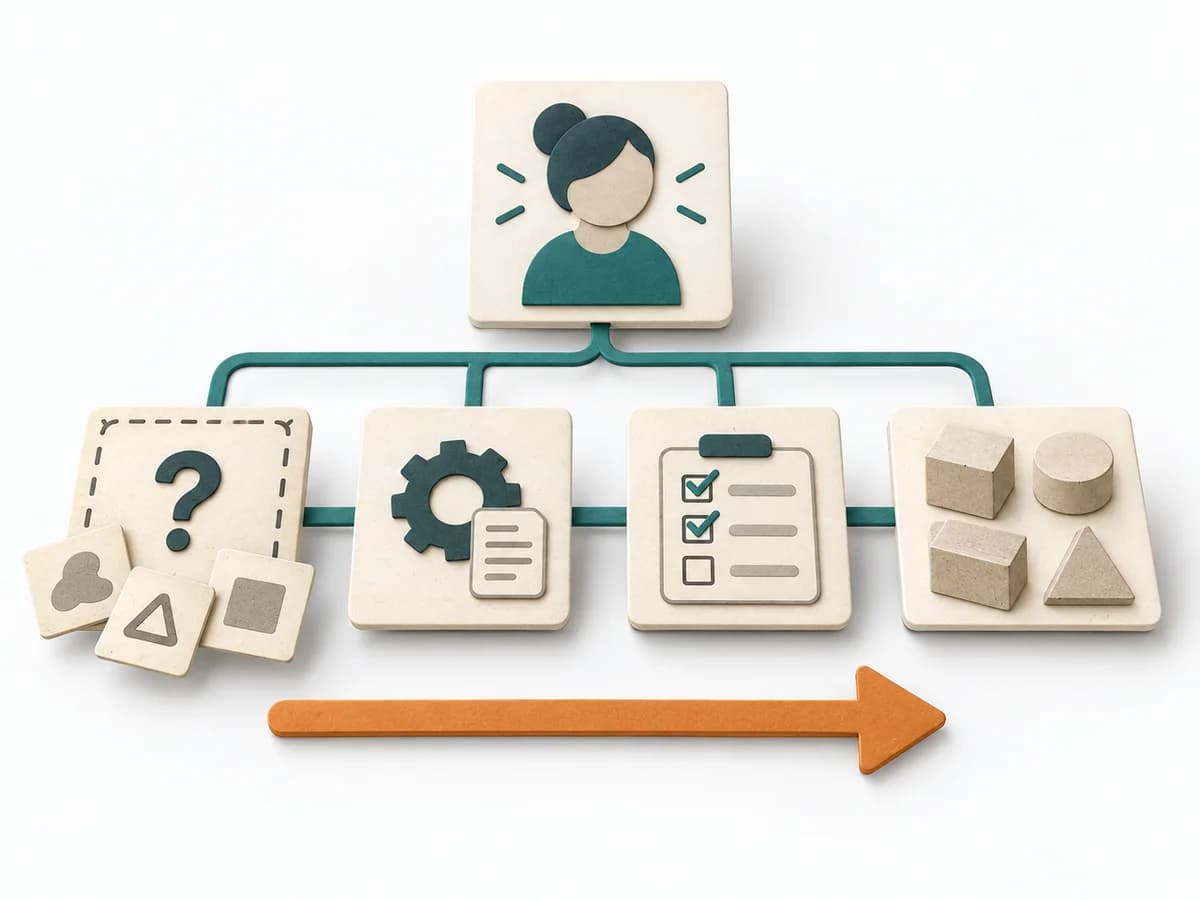 Systems Thinking Wardley Mapping |
|---|---|---|---|---|
Purposedifferent | When several contexts need to talk to each other, it makes their relationships and dependencies legible. It helps sort integration pressure and responsibilities across system boundaries. | A Behavior Over Time Graph shows how a metric or observation develops over time. The method makes trends, breaks, and recurring patterns visible that get lost in snapshots. | When a domain model and its associated contexts need to be thought through together, it creates a shared overview. It connects the business view and organizational boundary into a readable whole. | Wardley Mapping makes visible where an offering stands today and where it can evolve. The method connects user need, value chain, and evolution stages into a strategic basis for platform, build, or buy decisions. |
Complexitydifferent | Medium | Low | Medium | Medium |
Timedifferent | 1-3 h | 20-45 min | 1-3 h | 1-3 h |
Participantsdifferent | 2-8 | 1-10 | 3-10 | 2-10 |
Formatdifferent | Workshop + async | Workshop + async | Workshop | Workshop + async |
Outputdifferent | Context Map, Integration Patterns, Boundary Notes | Behavior Over Time Graph, Trend Hypotheses, Key Events | Domain Context Map, Boundary Notes, Ownership Map | Wardley Map, Strategic Options, Evolution Notes |
Tagsno overlap | Domain-Driven DesignBoundariesStrategy | Systems thinkingPatternsDynamics | Domain-Driven DesignContextBoundaries | StrategySystems thinkingDynamics |