View methods side by side.
Choose up to four methods. Add them using the search and share the comparison by copying its link.
| Criterion |  DevOps ChatOps | 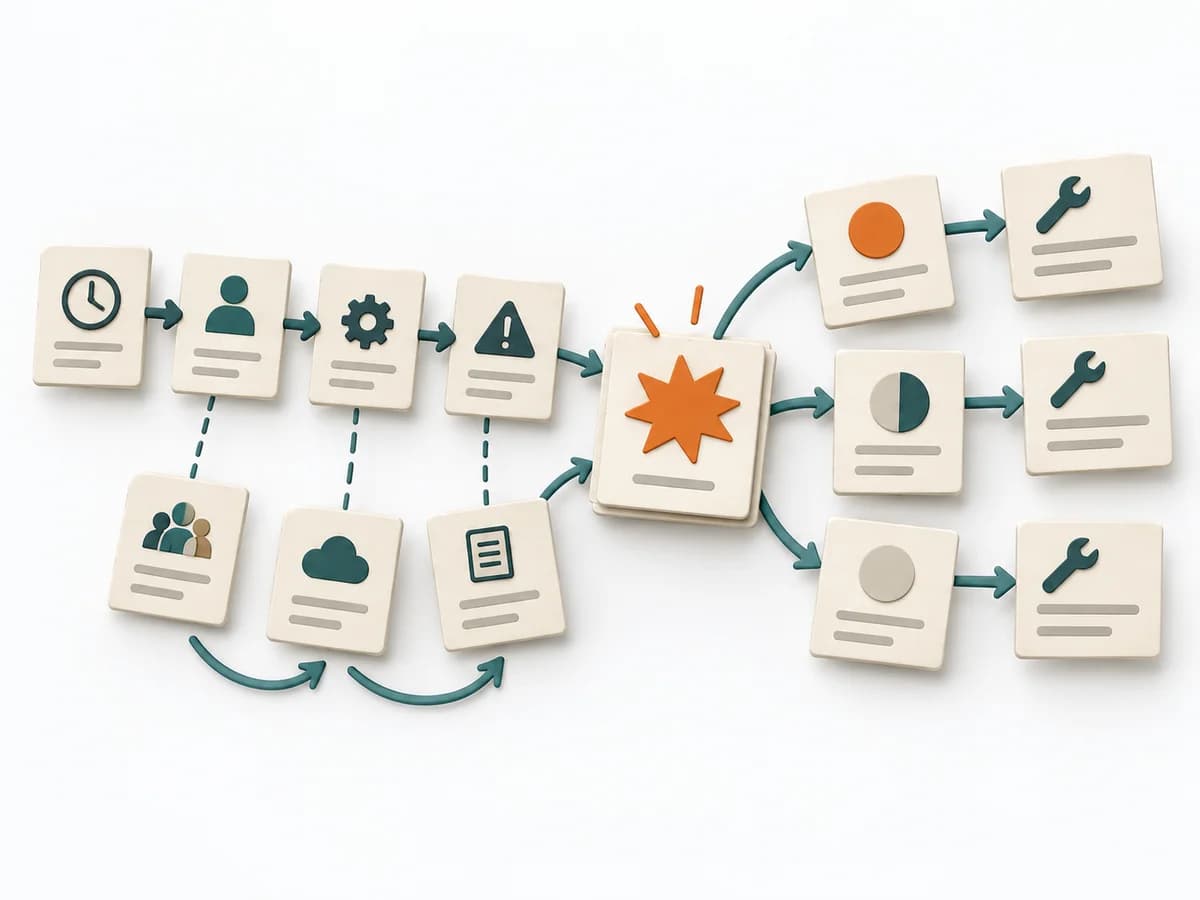 Operations Causal Factor Analysis |  Product Strategy OKRs |  Business Strategy Strategy Map |
|---|---|---|---|---|
Purposedifferent | For operational work in a distributed team, the method links communication with direct system control. It records decisions right where the signal, the context, and the execution come together. | For an event with a complicated course, the method breaks down the contributing factors along the timeline. It shows how conditions, decisions, and reactions together produce a course of events. | When strategic direction needs to become measurable, it connects ambition with checkable results. It makes goals connectable to focus and review. | A Strategy Map translates strategy into a few connected objectives across perspectives such as finance, customers, processes, and learning. This makes visible which capabilities and activities are meant to drive which results. |
Complexitydifferent | Medium | High | Medium | Medium |
Timedifferent | Ongoing | 2-6 h | 1-2 h Setup | 2-4 h workshop plus review |
Participantsdifferent | 2-20 | 3-10 | 2-20 | 4-10 |
Formatdifferent | Workshop + async | Workshop + async | Workshop + async | Workshop |
Outputdifferent | Chat Transcript, Action Log, Automations | Event Timeline, Causal Factor Chart, Cause List, Corrective Actions | OKR set, Measurement plan, Review cadence | Strategy Map, Objective Set, Cause-Effect Hypotheses |
Tagsno overlap | CollaborationEngineeringIncident | CausalityIncidentRoot causeTimeline | GoalsAlignmentOutcomesMeasurement | AlignmentExecutionGoalsCausality |