View methods side by side.
Choose up to four methods. Add them using the search and share the comparison by copying its link.
| Criterion |  Operations Change Analysis | 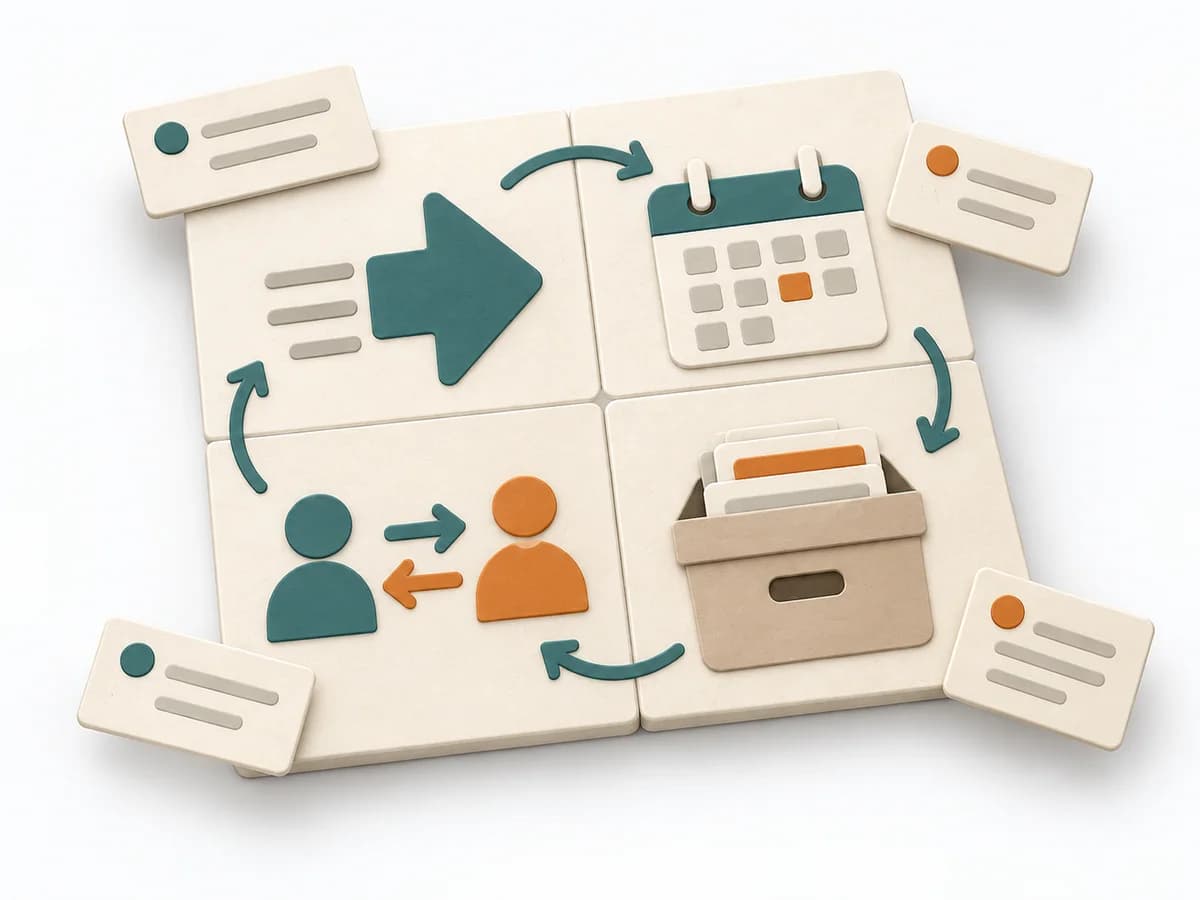 Decision Making Eisenhower Matrix |  Product Strategy ICE Scoring | 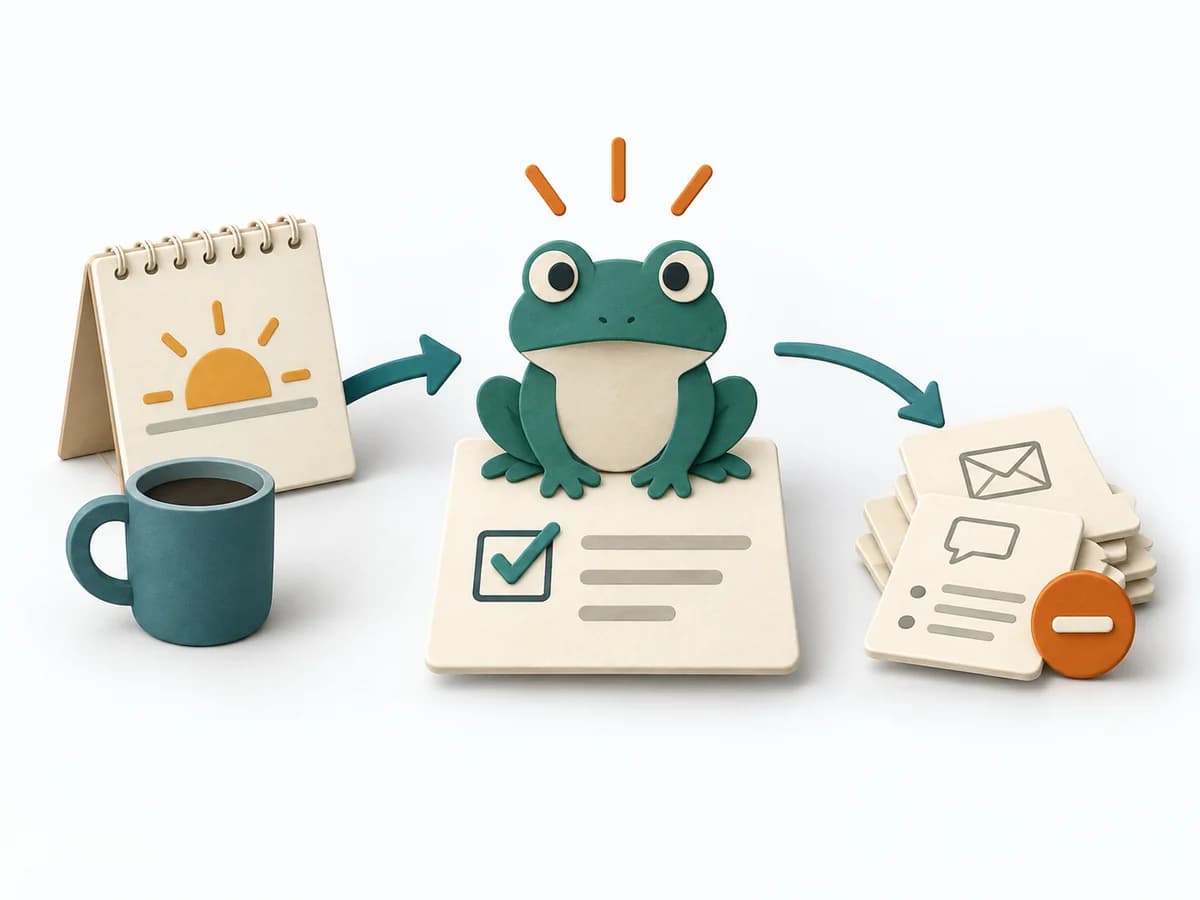 Operations Eat the Frog |
|---|---|---|---|---|
Purposedifferent | For a deviation after a change, the method isolates the influence of the altered condition. It narrows down which differences are relevant and which are just accompanying noise. | It separates true priorities from noise so it becomes clear what should be done now, scheduled, delegated, or dropped. | When ideas need sorting quickly, it condenses impact, confidence, and effort into one compact score. It connects customer value, product logic, and decision priorities. The result is captured as an ICE table and top-ideas list. | The method protects energy and attention for the task that creates the largest progress and is often postponed. |
Complexitydifferent | Medium | Low | Low | Low |
Timedifferent | 45-120 min | 15-30 min | 30-60 min | 15-90 min daily |
Participantsdifferent | 2-6 | 1-6 | 2-8 | 1 |
Formatdifferent | Workshop + async | Workshop + async | Workshop + async | Async |
Outputdifferent | Change Matrix, Cause Hypotheses, Validation Questions, Action List | Eisenhower Matrix, Action List, Delegation Notes | ICE Table, Top Idea List | Priority Task, Completion Note, Daily Focus |
Tagsno overlap | ChangeRoot causeTroubleshootingComparison | PrioritizationFocusTasks | PrioritizationScoringGrowthDecision | PrioritizationProductivityFocusExecution |