View methods side by side.
Choose up to four methods. Add them using the search and share the comparison by copying its link.
| Criterion | 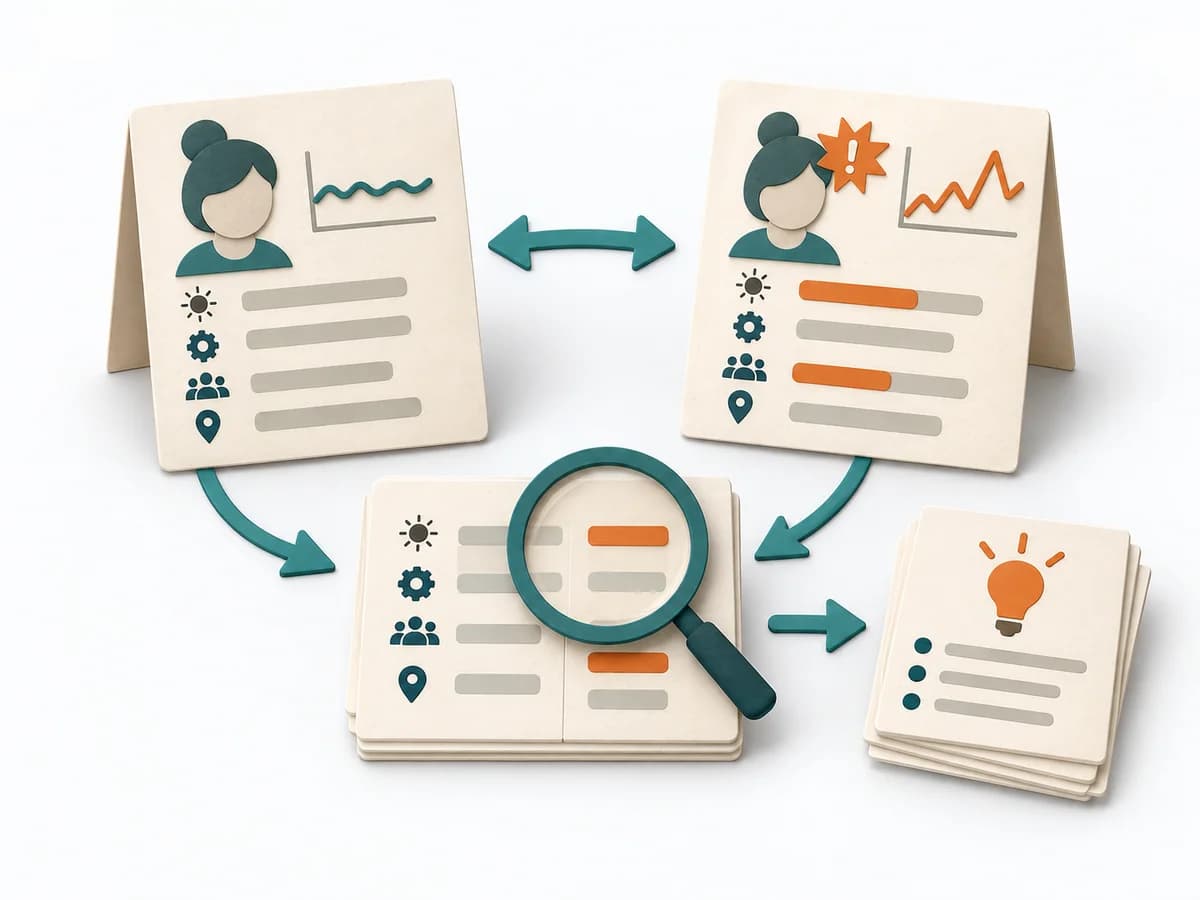 Operations Change Analysis | 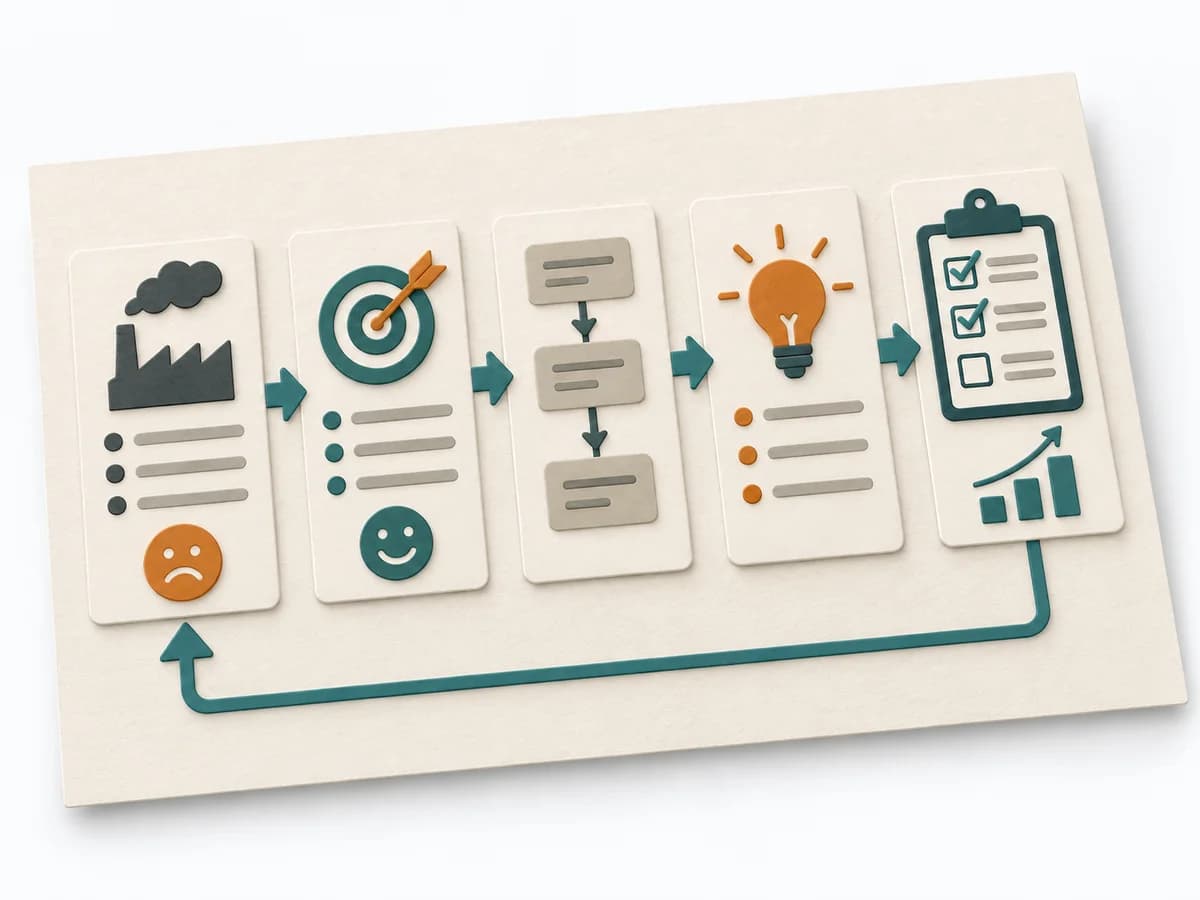 Operations A3 Problem Solving |  Systems Thinking Behavior Over Time Graph |  Operations Kepner-Tregoe |
|---|---|---|---|---|
Purposedifferent | For a deviation after a change, the method isolates the influence of the altered condition. It narrows down which differences are relevant and which are just accompanying noise. | For a complex deviation with several people involved, the method bundles problem, analysis, and decision onto one page. It creates a shared working space where causes, countermeasures, and follow-up fit together. | A Behavior Over Time Graph shows how a metric or observation develops over time. The method makes trends, breaks, and recurring patterns visible that get lost in snapshots. | For a disturbance that's hard to pin down, the method cleanly separates problem, cause, and decision. It reduces mixing when symptoms allow several interpretations. |
Complexitydifferent | Medium | Medium | Low | High |
Timedifferent | 45-120 min | 45-90 min | 20-45 min | 2-8 h |
Participantsdifferent | 2-6 | 2-5 | 1-10 | 2-8 |
Formatsame | Workshop + async | Workshop + async | Workshop + async | Workshop + async |
Outputdifferent | Change Matrix, Cause Hypotheses, Validation Questions, Action List | A3 Report, Action Plan, Root Cause Analysis | Behavior Over Time Graph, Trend Hypotheses, Key Events | Problem Analysis, Decision Analysis, Risk Plan |
Tagsno overlap | ChangeRoot causeTroubleshootingComparison | LeanProblem solvingCoachingOperations | Systems thinkingPatternsDynamics | Problem solvingRoot causeDecisionOperations |