View methods side by side.
Choose up to four methods. Add them using the search and share the comparison by copying its link.
| Criterion | 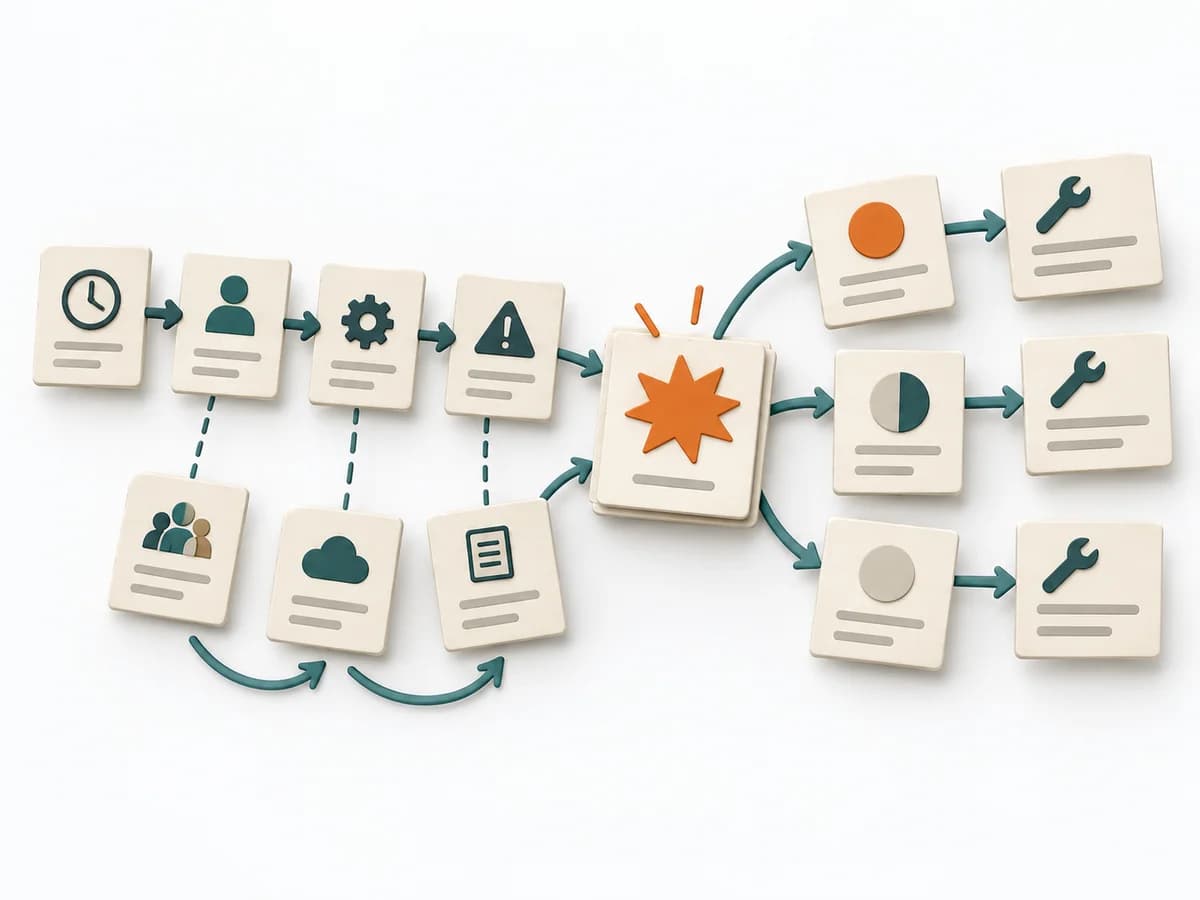 Operations Causal Factor Analysis |  Product Discovery Assumption Mapping |  Decision Making OODA Loop | 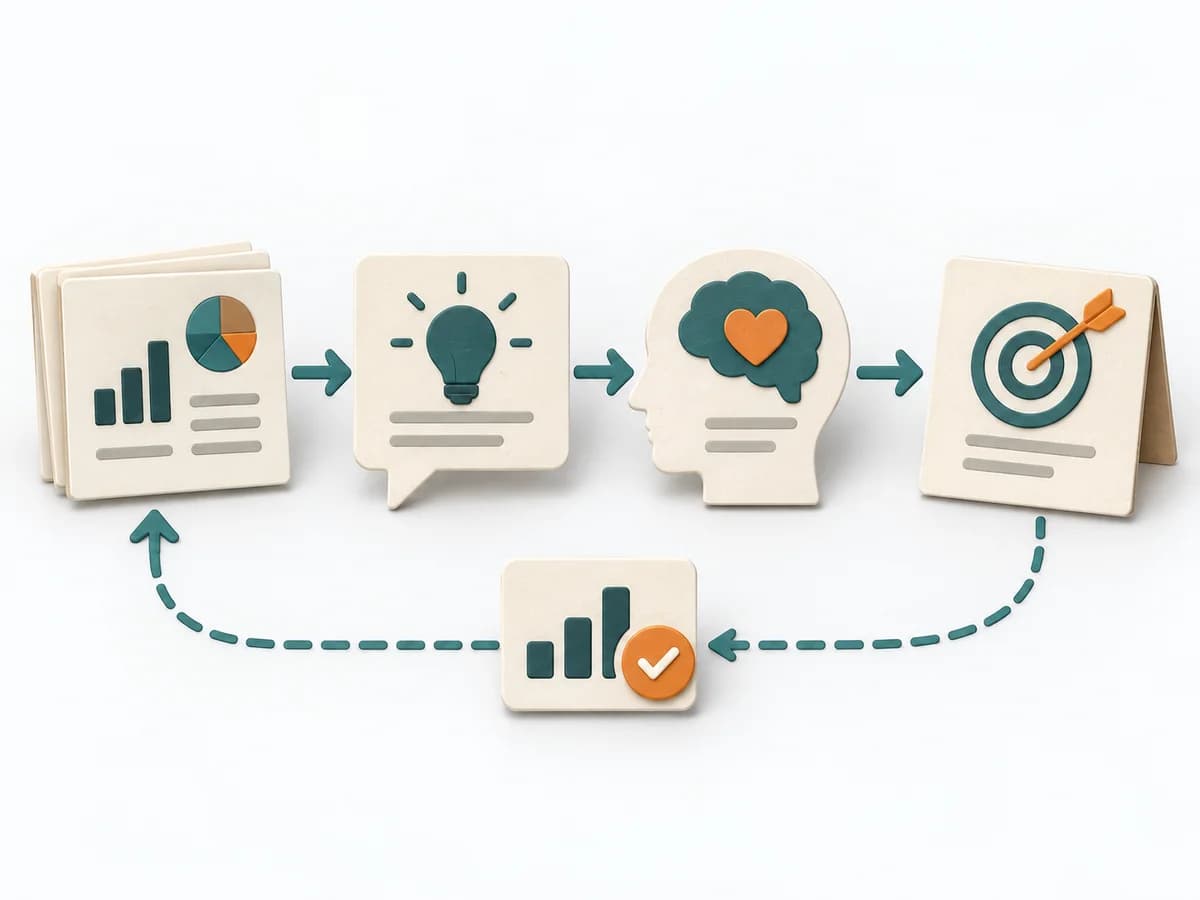 Product Strategy DIBB |
|---|---|---|---|---|
Purposedifferent | For an event with a complicated course, the method breaks down the contributing factors along the timeline. It shows how conditions, decisions, and reactions together produce a course of events. | When assumptions still sit unordered in the room, it weighs uncertainty against leverage. It makes visible which hypotheses should be checked first. | In dynamic situations, decisions become outdated faster than they can be prepared. The OODA Loop holds observing, orienting, deciding, and acting together as a recurring rhythm so reaction does not slide into inertia. | DIBB helps clarify target groups, value, goals, and priorities by making the logic behind a decision explicit. It captures results as a DIBB document, belief list, bet list, and learning report. |
Complexitydifferent | High | Medium | Medium | Low |
Timedifferent | 2-6 h | 45-60 min | 15-60 min je Zyklus | 1-2 h |
Participantsdifferent | 3-10 | 2-8 | 1-8 | 2-8 |
Formatsame | Workshop + async | Workshop + async | Workshop + async | Workshop + async |
Outputdifferent | Event Timeline, Causal Factor Chart, Cause List, Corrective Actions | Assumption map, Test backlog, Risk ranking | Situation Assessment, Decision Loop, Action Updates | DIBB document, Belief list, Bet list, Learning report |
Tagsno overlap | CausalityIncidentRoot causeTimeline | AssumptionsRiskExperimentsValidation | DecisionChangeLearningStrategy | StrategyDecisionAssumptionsHypothesis |