View methods side by side.
Choose up to four methods. Add them using the search and share the comparison by copying its link.
| Criterion |  Operations Bottleneck Analysis | 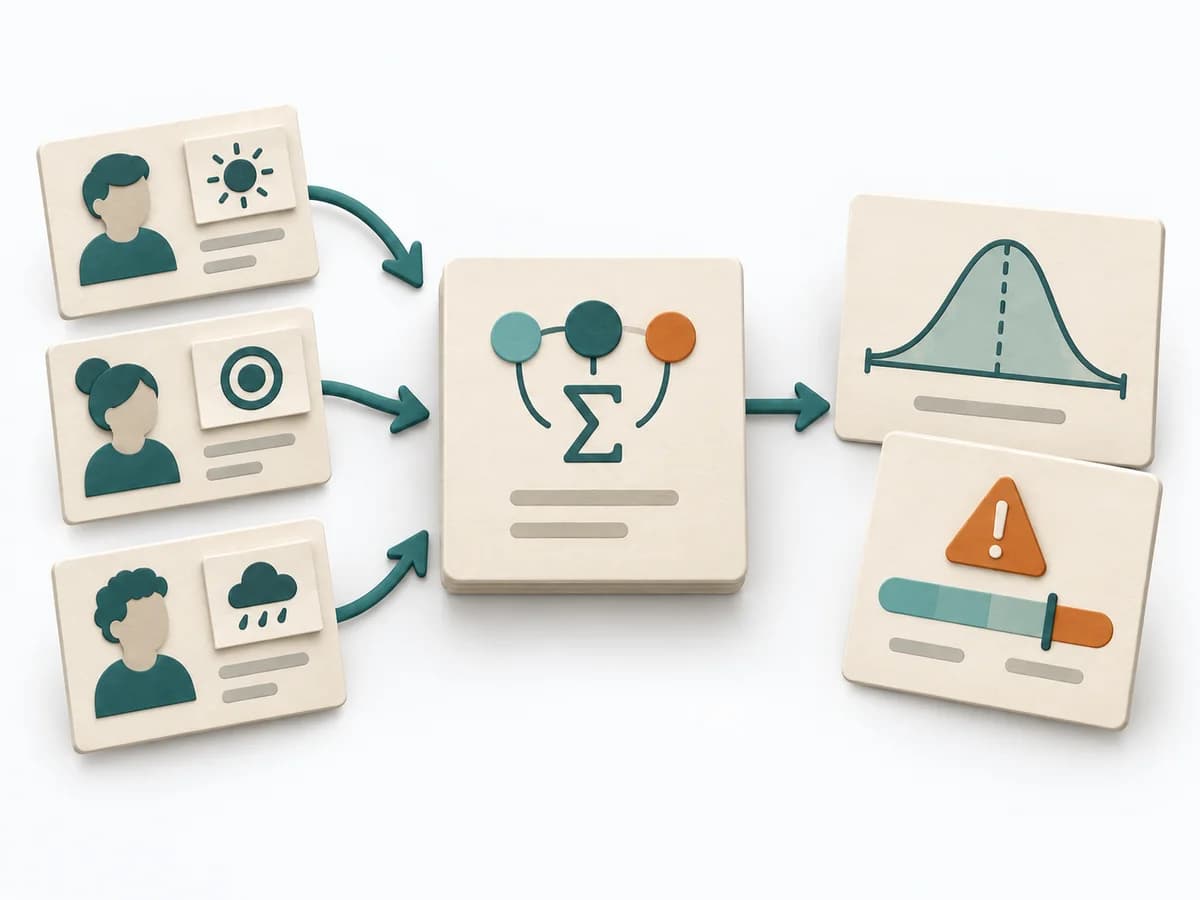 Decision Making PERT Estimation |  Systems Thinking Behavior Over Time Graph |
|---|---|---|---|
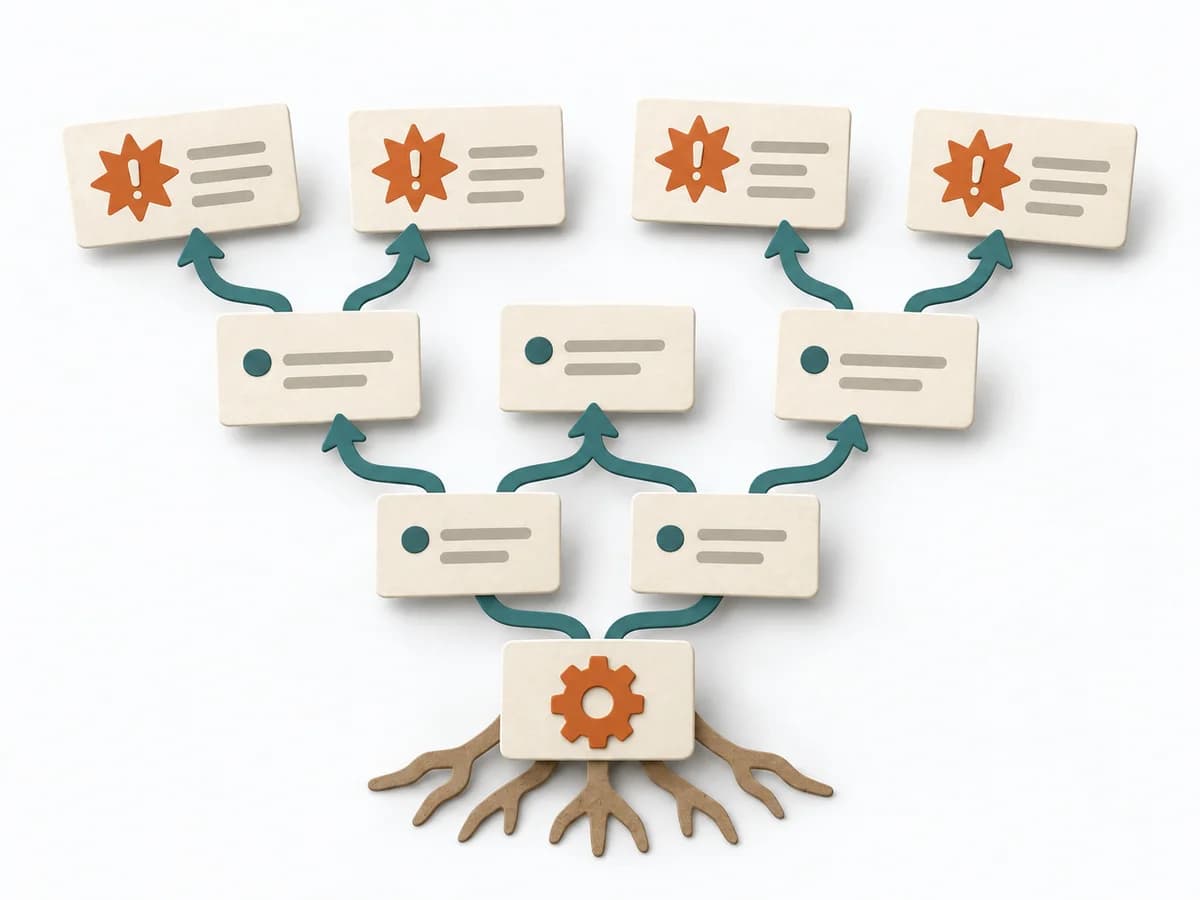
Purposedifferent | For a flow that backs up at one point, the method looks for the capacity limit with the greatest leverage. It explains why extra effort elsewhere barely improves throughput. | On complex initiatives, a plain average tends to understate just how uncertain the outcome really is. It separates options, evaluation criteria, and open risks. The result is captured as a PERT Estimate, Expected Value, and Risk Notes. | A Behavior Over Time Graph shows how a metric or observation develops over time. The method makes trends, breaks, and recurring patterns visible that get lost in snapshots. |
Complexitydifferent | Medium | Medium | Low |
Timedifferent | 1-3 h | 15-45 min | 20-45 min |
Participantsdifferent | 3-8 | 1-8 | 1-10 |
Formatsame | Workshop + async | Workshop + async | Workshop + async |
Outputdifferent | Bottleneck Map, Flow Metrics, Improvement Options, Follow-up Measures | PERT Estimate, Expected Value, Risk Notes | Behavior Over Time Graph, Trend Hypotheses, Key Events |
Tagsno overlap | FlowMeasurementConstraints | EstimationUncertaintyRisk | Systems thinkingPatternsDynamics |
Often compared together
Methods with strong topical overlap with the current selection, not yet in the comparison.