View methods side by side.
Choose up to four methods. Add them using the search and share the comparison by copying its link.
| Criterion | 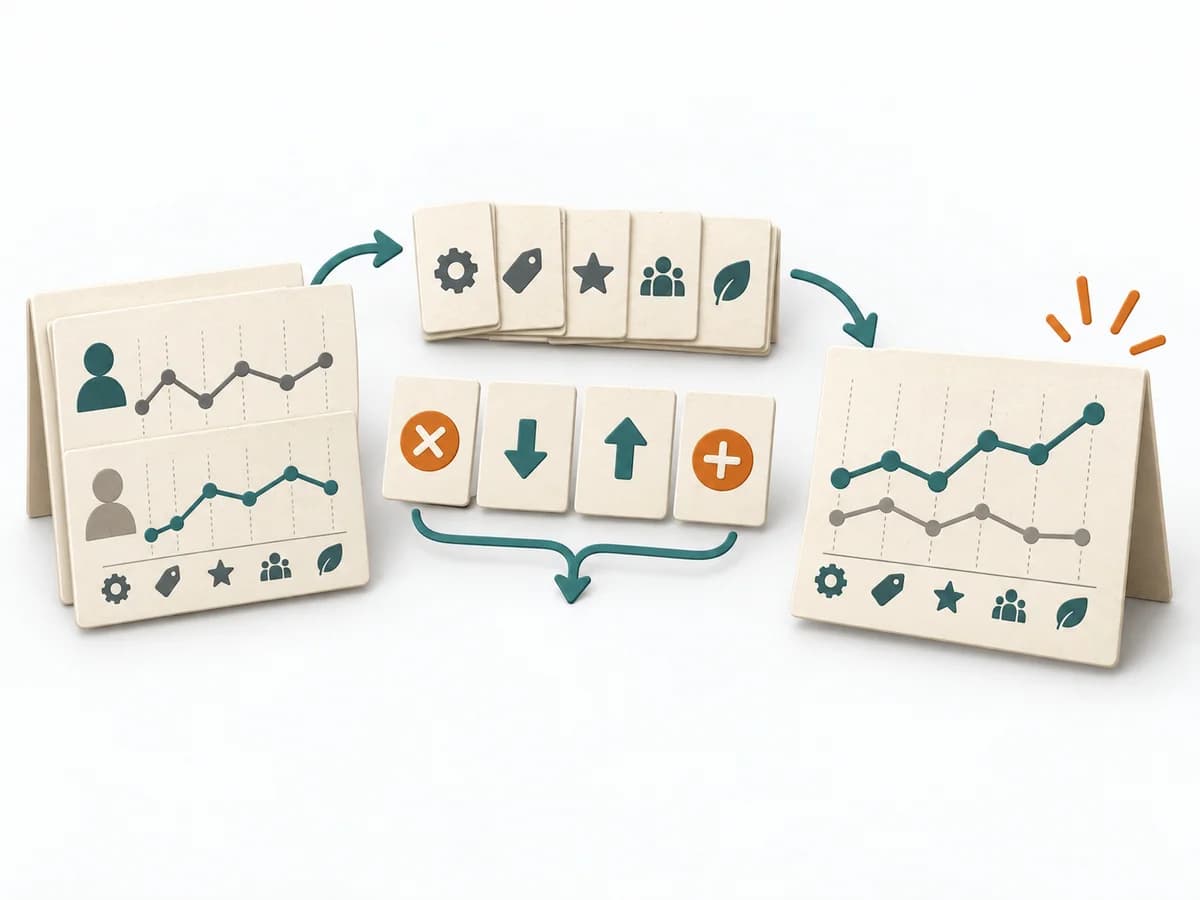 Business Strategy Blue Ocean Strategy Canvas |  Operations Process Mapping | 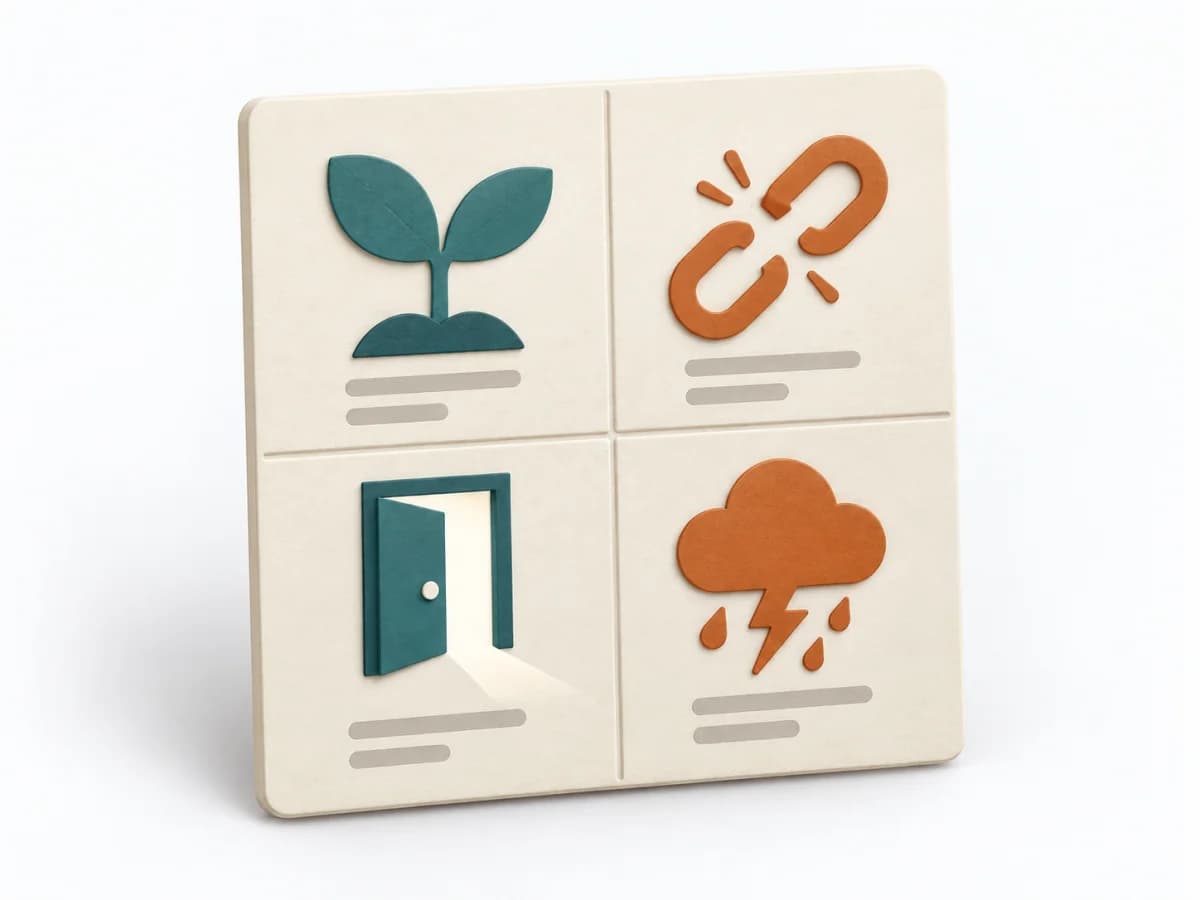 Business Strategy SWOT Analysis | 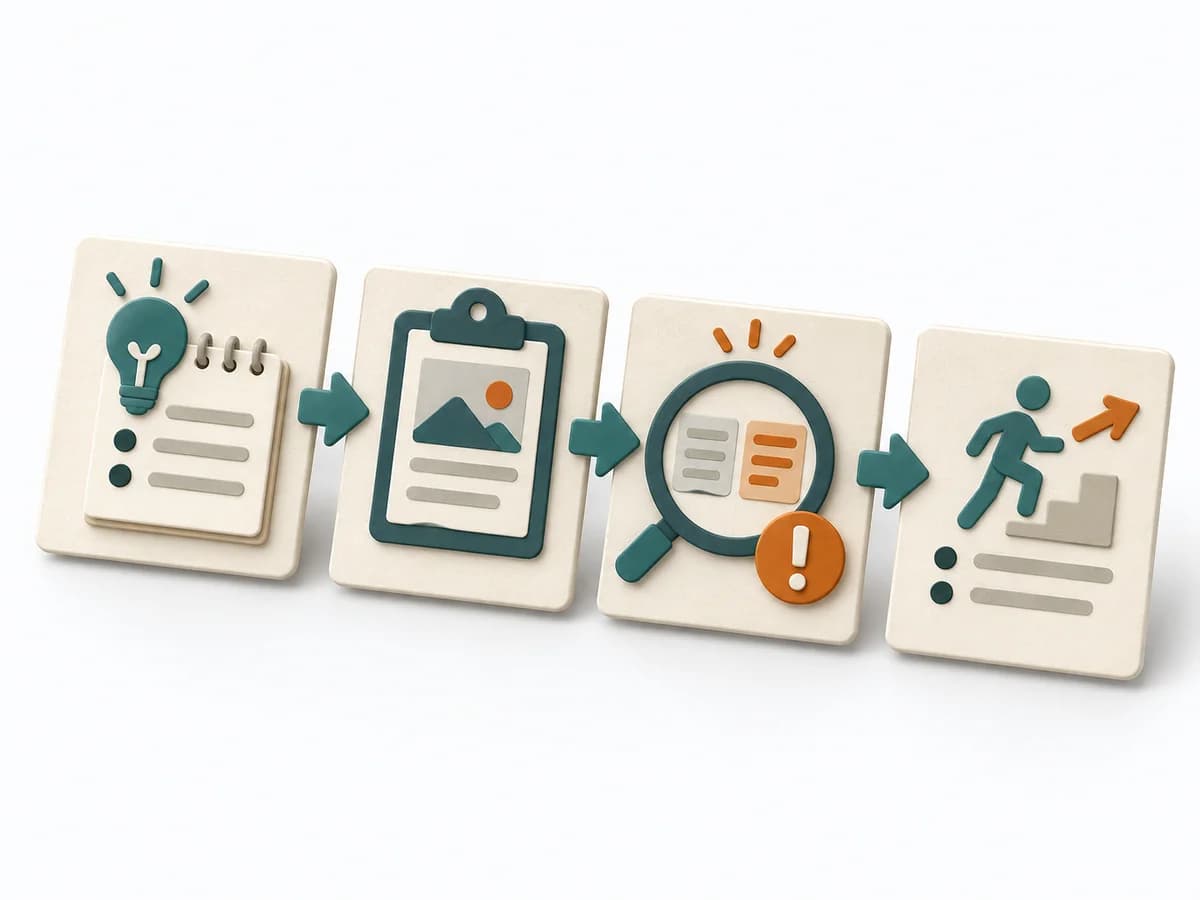 Operations After-Action Review |
|---|---|---|---|---|
Purposedifferent | The Blue Ocean Strategy Canvas shows how an offering is positioned relative to the market. Differentiation thereby becomes tangible in value factors instead of merely being claimed. | With a confusing workflow that has many handoffs, the method makes the actual process visible. It shows where work is passed on, delayed, or duplicated, so improvement targets the right spots. | SWOT Analysis arranges strengths, weaknesses, opportunities, and threats into a compact picture of the situation. It keeps internal capabilities and external influences separate before strategic options emerge from them. | After missions or project phases with unclear outcomes, the method makes visible what actually happened and what can be learned from it. It separates course, effect, and causes so experience turns into solid improvement. |
Complexitydifferent | Medium | Medium | Low | Low |
Timedifferent | 2-4 h | 1-3 h | 30-60 min | 20-45 min |
Participantsdifferent | 3-10 | 3-10 | 3-12 | 3-12 |
Formatdifferent | Workshop | Workshop | Workshop | Workshop + async |
Outputdifferent | Strategy Canvas, Value Curve, ERRC Actions | Process Map, Handoff List, Improvement Backlog | SWOT matrix, Strategic options, Action list | Lessons learned, Action items, Event summary |
Tagsno overlap | StrategyPositioningInnovationValue | ProcessOperationsImprovement | StrategyAnalysisMarketPositioning | LearningOperationsImprovement |