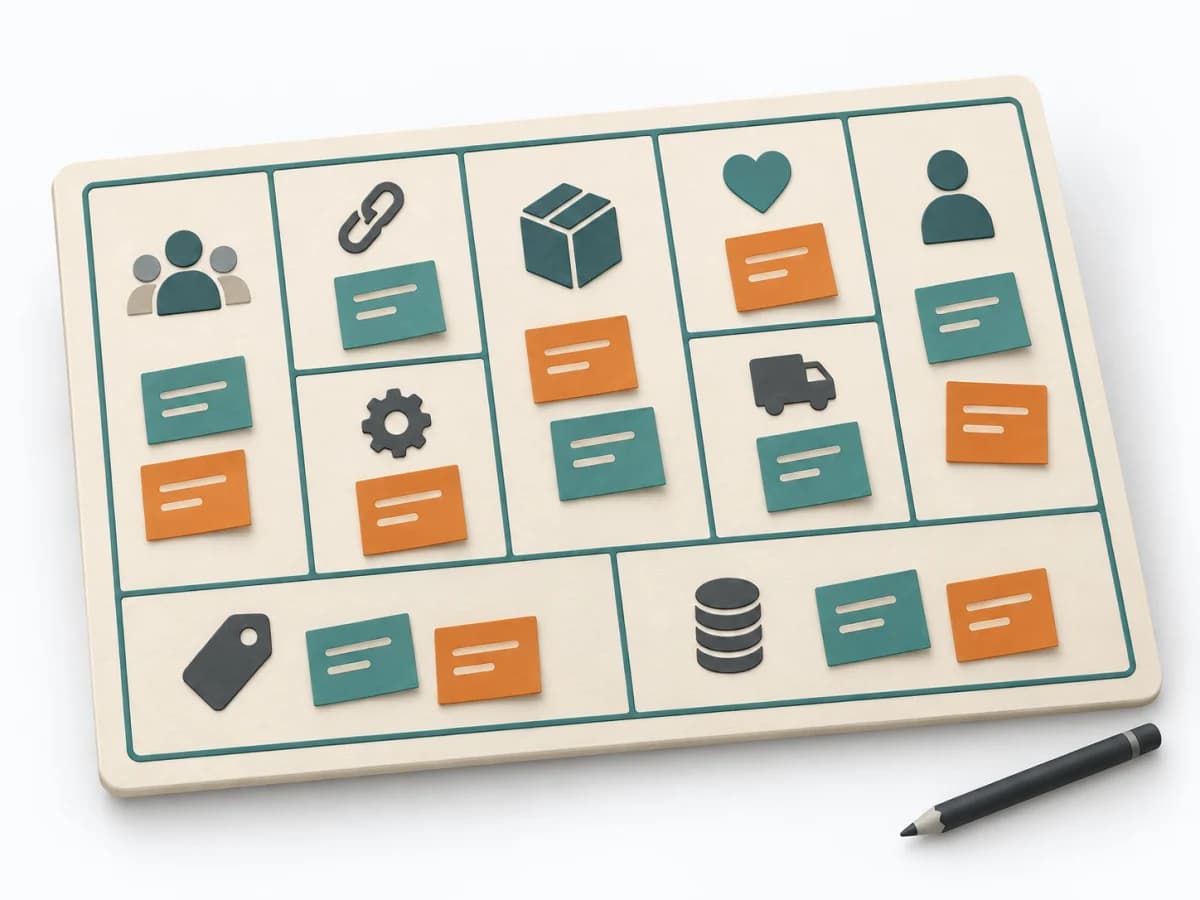
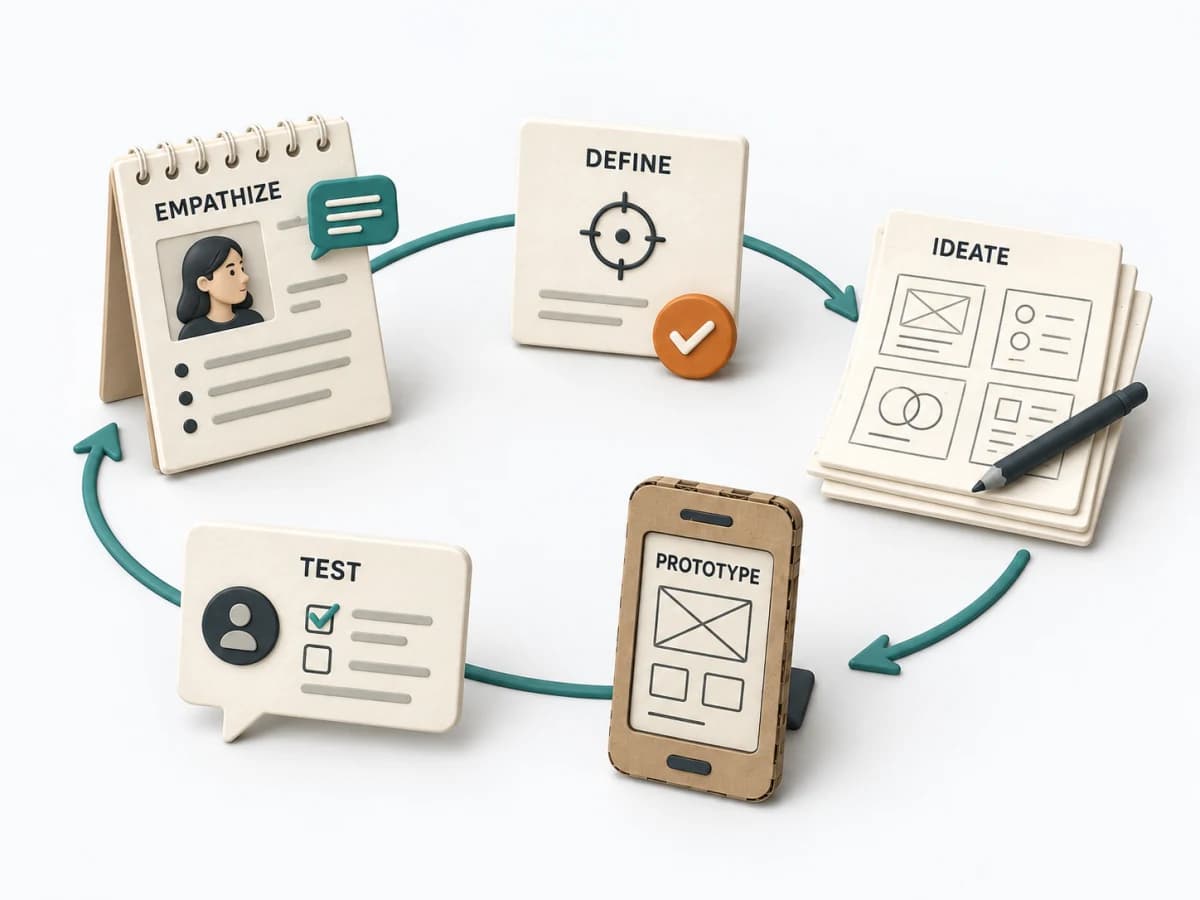
View methods side by side.
Choose up to four methods. Add them using the search and share the comparison by copying its link.
| Criterion | 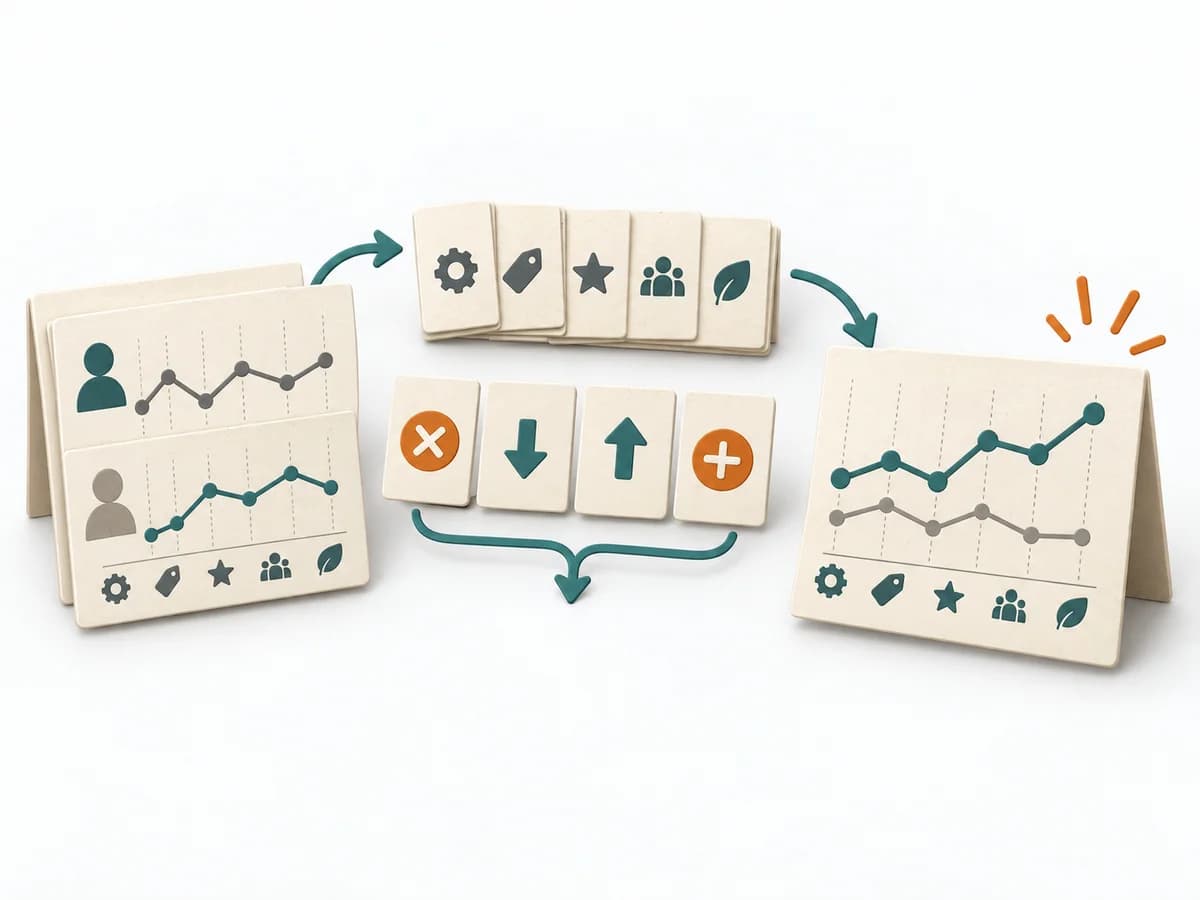 Business Strategy Blue Ocean Strategy Canvas | 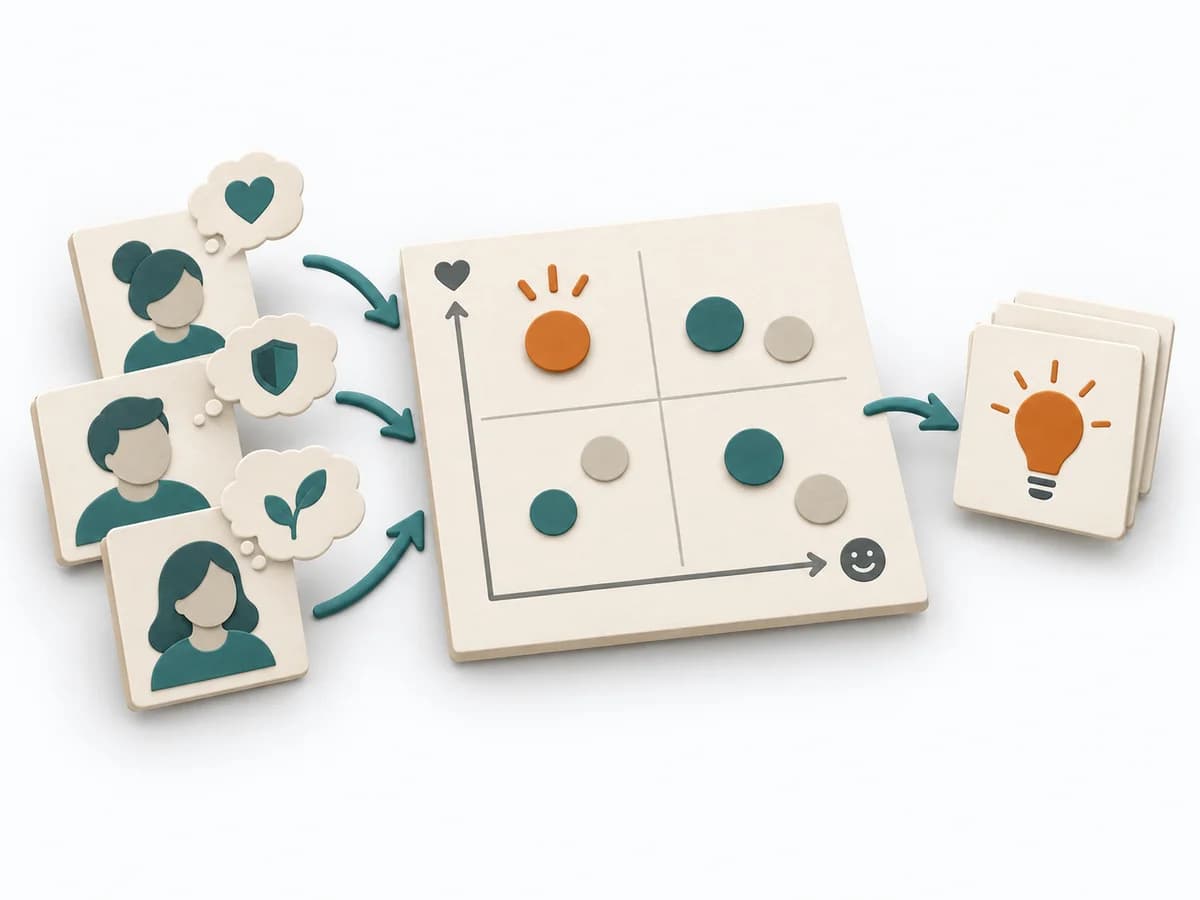 Product Discovery Outcome-Driven Innovation |  Product Strategy Counter Metrics |
|---|---|---|---|
Purposedifferent | The Blue Ocean Strategy Canvas shows how an offering is positioned relative to the market. Differentiation thereby becomes tangible in value factors instead of merely being claimed. | Outcome-Driven Innovation clarifies customer problems, solution opportunities, and evidence. It separates jobs, desired outcomes, importance, satisfaction, and opportunity, and captures results as desired outcome statements, an opportunity landscape, and segments by underserved needs. | When a headline metric could mask side effects, it adds guardrail signals against unwanted outcomes. It connects customer value, product logic, and decision priorities. The result is captured as a counter-metric list and guardrail definitions. |
Complexitydifferent | Medium | High | Low |
Timedifferent | 2-4 h | Mehrere Wochen | 30-60 min |
Participantsdifferent | 3-10 | 2-6 researchers plus sample | 2-6 |
Formatdifferent | Workshop | Workshop + async | Workshop + async |
Outputdifferent | Strategy Canvas, Value Curve, ERRC Actions | Desired outcome statements, Opportunity landscape, Segmentation by underserved needs, Innovation hypotheses | Counter Metric List, Guardrail Definitions |
Tagsno overlap | StrategyPositioningInnovationValue | OutcomesInnovationResearchQuantitative | MetricsMeasurementStrategyExperiments |
Often compared together
Methods with strong topical overlap with the current selection, not yet in the comparison.